






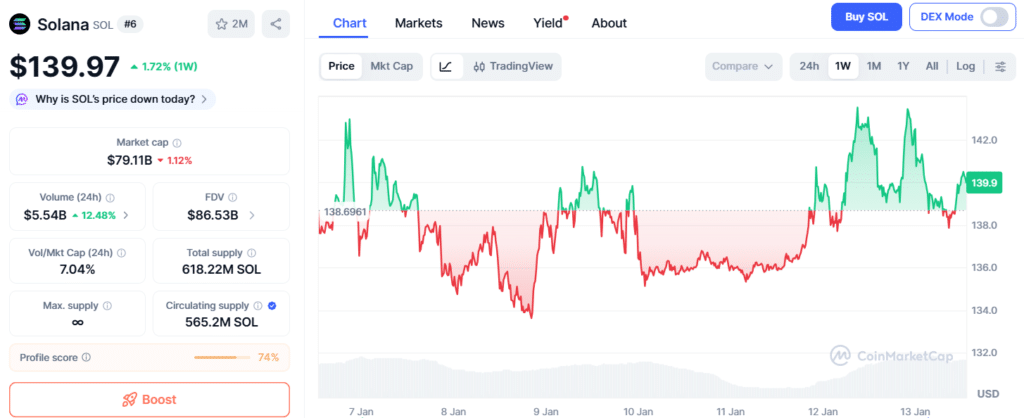
The Solana price forecast has reached an important stage as buying momentum continues to build near a key resistance level that has held for a long time. This places the asset at a crucial point both technically and in terms of market sentiment. Current market positioning shows buyers gradually strengthening their grip just below $145.
At the same time, derivatives data and spot market flows point to rising trader confidence, even though on-chain activity has clearly slowed. Overall, this environment highlights a market driven mainly by trader positioning and price momentum, rather than growth in network usage, shaping Solana’s short-term direction.
Why does declining wallet growth matter for Solana’s outlook?
While the Solana price forecast continues to look positive, data from the network itself tells a different story. The number of new weekly wallets has dropped sharply, falling from 30.2 million in November to just 7.3 million in recent weeks. This decline is important because sustained price momentum usually depends on growing participation.
Prices can move ahead of actual usage for a period, but fundamentals eventually need to align with market direction. For now, traders appear willing to focus on momentum and short-term price action rather than network growth.
Has Solana’s technical structure shifted after the channel breakout?
The Solana price forecast shows signs of strengthening after the asset broke out of a multi-month descending channel. This breakout has altered the broader technical structure, indicating a possible transition from a corrective phase toward recovery.
The $145 level remains the immediate ceiling, and a sustained hold above former channel resistance would be required to confirm the reversal. The MACD has turned bullish, with rising histogram bars pointing to increasing upside momentum. However, failure to maintain this structure could still lead Solana back into consolidation.
How do exchange outflows support the Solana price forecast?
Spot market data continues to support the Solana price forecast without drawing much attention. Netflows stayed negative, with exchange withdrawals around -$1.53 million while the current price remained near $140. Tokens leaving exchanges usually point to holding activity rather than selling pressure.
The scale of these outflows is moderate, suggesting stable support instead of aggressive accumulation. Under such conditions, price can move higher gradually without showing signs of exhaustion, provided inflows do not rise sharply near key resistance levels.
What do liquidation trends reveal about trader positioning?
Liquidation data is adding further weight to the Solana price forecast as the asset trades near resistance. On January 12, short liquidations climbed to around $7.24 million, clearly exceeding long liquidations, which stood near $3.75 million.
A large portion of these losses came from positions on Binance and Bybit. Even with bearish traders attempting to push the price lower, Solana remained steady. If the price moves decisively above $145, it could trigger more short liquidations, leading to increased upside volatility.
| Metric | Value |
|---|---|
| New Weekly Wallets | 30.2M (Nov) → 7.3M (recent) |
| Exchange Netflows | -$1.53M (at ~$140) |
| Short Liquidations | $7.24M (Jan 12) |
| Long Liquidations | $3.75M (Jan 12) |
| OI-Weighted Funding | +0.0072% |
| Current Price | ~$140 |
| Key Resistance | $145 ($150-170 next) |
| MACD Status | Bullish flip + rising histogram |
Does funding data confirm bullish conviction?
Funding metrics continue to support the Solana price forecast. Open Interest weighted funding rates turned positive at 0.0072%, indicating that traders were willing to pay to stay long.
This behavior points to strong conviction rather than hesitation in the market. While rising funding can sometimes signal risk, it currently remains controlled, meaning leverage is helping support price movement without creating distortions.
Can Solana convincingly break above $145?
At its core, the Solana price forecast reflects whether momentum can overcome the $145 ceiling. Current structural positioning, controlled funding, and moderate supply support buyers in the near term.

If price moves above $145, momentum could open the path toward $150 and $170, provided follow-through holds. However, network growth has slowed, so fundamentals are trailing price, which could limit how sustainable the rally remains if sentiment eases.
Conclusion
The Solana price forecast indicates a market where momentum is currently stronger than fundamentals. Buyers are positioned near resistance, supported by the technical breakout, moderate spot outflows, and pressure on short positions.
Although network growth has slowed, current positioning continues to influence price action. As long as sentiment remains positive and funding stays controlled, Solana has the potential to extend its rally beyond $145 in the near term.
Glossary
MACD: Shows price momentum and possible trend changes.
Spot Market: Where crypto is bought and sold instantly.
Funding Rate: Fee showing trader sentiment in derivatives.
Channel Breakout: Price moves above a chart channel, signaling a trend shift.
Wallet Growth: Number of new wallets or users joining the network.
FAQs About Solana Price Forecast
Why is $145 important for Solana?
$145 is a key resistance level that needs to break for the rally to continue higher.
Does wallet growth affect Solana’s outlook?
Yes, declining new wallets mean fewer active participants, which could limit long-term momentum.
How do exchange outflows support Solana’s price?
Tokens moving off exchanges show holding behavior, which reduces selling pressure and supports the rally.
What do liquidation trends tell us about traders?
Short positions are under pressure, showing that bearish traders are losing and buyers are controlling momentum.
Does funding data confirm bullish sentiment?
Yes, positive funding rates indicate that traders are confident and willing to stay long.
Sources