






This Article Was First Published on The Bit Journal.
Despite a huge outflow of $63 million XRP transfer to Binance during last Friday’s market crash, buying pressure around $2 has reasserted confidence. Meanwhile, the newly launched REX-Osprey spot XRP ETF (XRPR) has over $90 million in assets under management. Analysts are interpreting this as smart money buying the dip, hence a bullish XRP price prediction scenario.
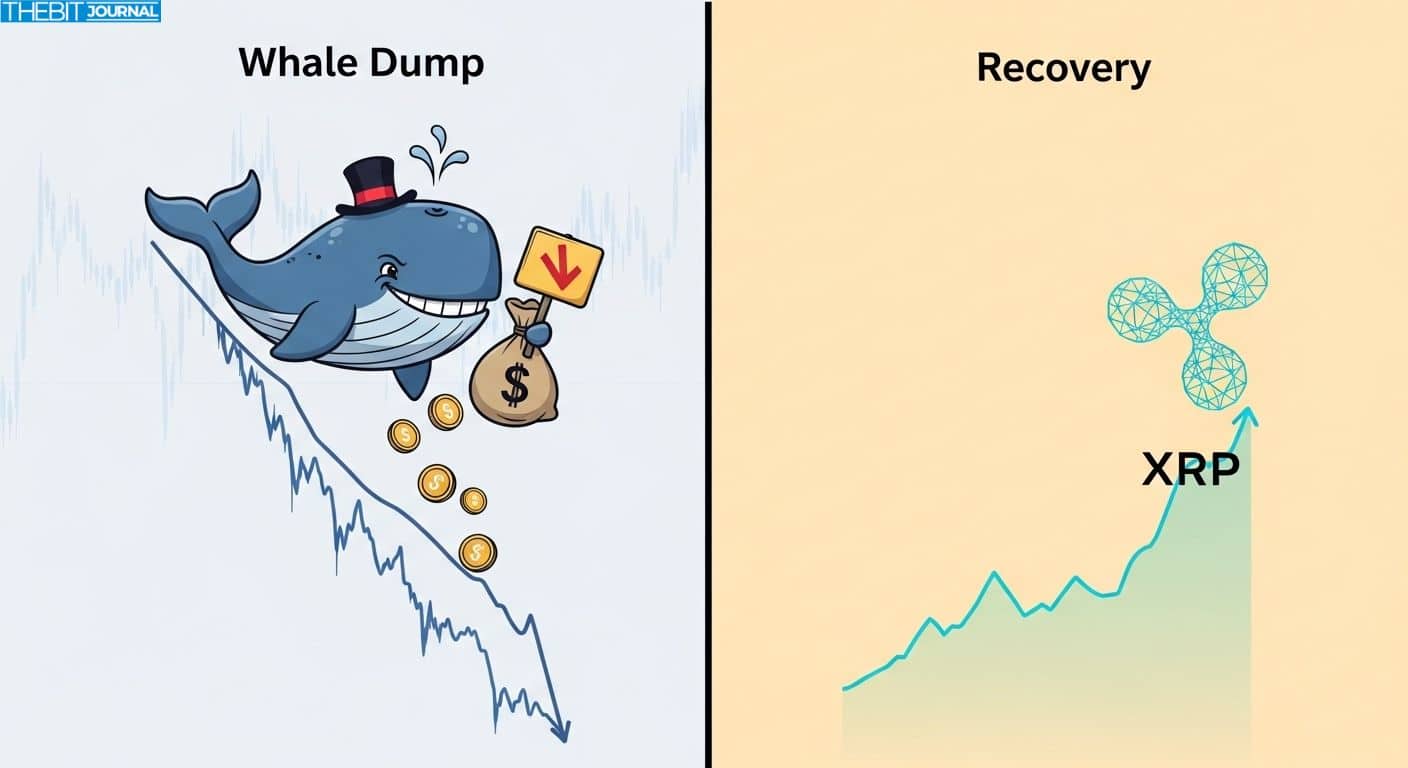
The $63M Whale Dump and Market Reaction
The $63 million XRP transfer to Binance spooked many. Large wallet movements to centralized exchanges are usually seen as a precursor to sell pressure. But in this case, it didn’t trigger a broad sell-off. Instead, buyers stepped in at $2 and absorbed most of the supply.
The quick move to $2.50 with strong volume (4% of circulating supply) showed conviction. The newly listed XRPR ETF also held steady with over $90 million in assets, which means institutional money is proving resilient to volatility.
Technical Setup and Price Structure
XRP’s price structure showed after the $63M dump, it found support at $2 which is a trendline bounce. That bounce was on strong volume, indicating hands were ready to step in. The RSI had oversold earlier and has now retraced up, showing momentum is coming back. XRP is still below the 200-day EMA which is a resistance level that needs to be broken for sustained upside.
If the price breaks $2.70 cleanly, it will confirm the trend is shifting to bullish. On further upside, the resistance zones will be $3.50 and $5+. If it can’t reverse above key resistances, it could go back to the support zones around $2 or below.
Analysts’ $XRP Price Prediction Table
Here is a summary of recent publicly reported analyst price forecasts for $XRP:
| Source | Target | Notes |
| DeepSeek AI | $10 | Predicts 4× gain by year-end. |
| BraveNewCoin | $5 | Forecasted after a bullish MACD crossover. |
| Ali Martinez | $11 | Predicting strong breakout, noted in multiple outlets. |
| Coinpedia | $5–8 billion in inflows | Suggests XRP price upside from institutional flows. |
| TradingView | $5.056 | Three-month target based on technicals. |
| Finbold | $4.80 to $5.50 | Range predicted for year end. |
These projections range from conservative (mid-single digits) to highly optimistic (double digits) based on different assumptions about adoption, ETF demand and technical breakout strength.
Bull, Base, Bear Scenarios for XRP Price Prediction
In the Bull case; $XRP bounces and breaks above $2.70 with conviction and volume. ETF inflows, institutional buying and regulatory news propel the token to $3.50 and possibly $5+ by year’s end. Some analysts see breakout patterns and MACD crossovers as confirmation.
In the Base case; $XRP trades in a range $2.50-$3.30 for a long time. Price oscillates as buyers and sellers battle with retests of $2.20-$2.50. No clear direction until a catalyst such as ETF flows, regulatory news; tips the momentum. This is the “wait and see” middle ground until one side wins.
In the Bear case; If selling pressure returns or $XRP fails to break resistance, it could fall to $2 or lower. A drop below $2 could force retests of lower support (e.g. $1.90). Analysts have $1.91 as a key level if $XRP fails to hold that, recovery to previous ranges becomes harder.
What to Watch and Catalysts Ahead
Several things will influence which path plays out:
First is ETF activity and capital flows. The launch of XRPR, the first US spot XRP ETF, is really notable. On its first trading day, XRPR saw $37.7 million in natural volume, the highest first day volume ETF in 2025.
It’s a hybrid fund; it holds $XRP directly and invests up to 40% in other XRP related ETFs to improve liquidity.

Regulatory news is also important. The ETF is structured under the Investment Company Act of 1940 so it’s more palatable in the US.
Also broader crypto market conditions, macro shifts and technical breakouts or breakdowns will matter. If $XRP breaks its 200 day EMA convincingly; it can trigger momentum buying. Some technical analysts see bull flag patterns on weekly charts that could confirm high targets, possibly to $15.
Conclusion
Based on the latest research; the $63M XRP whale dump to Binance caused panic but the market response shows conviction. Buyers absorbed supply at $2 and pushed the price up and triggered a bullish bounce.
XRP charts show a key bounce and RSI improving but the 200 day EMA resistance must be broken for sustained gains. Analysts are forecasting $5 to $11+. With the first US spot XRP ETF (XRPR) live and seeing volume, capital inflows, ETF demand and regulatory news will dictate if $XRP continues to go up.
Summary
Despite a $63M whale dump to Binance, $XRP bounced on strong buying and volume. Technicals support the bullish view with $2.70-$3.50 resistance. Analysts are forecasting $5 to $11+. The XRPR ETF debut with $37.7M volume shows institutional interest, so flows and regulation will be the key.
Glossary
Whale dump: Big transfer of crypto by one entity or entities, often seen as sell pressure.
Trendline bounce: Price bouncing off a sloped support or resistance line on charts.
RSI (Relative Strength Index): Momentum indicator that measures speed and change of price movements, used to flag overbought or oversold.
200-day EMA: Long term average of price used as signal for trend direction or resistance.
ETF (Exchange Traded Fund): Fund that tracks an asset or index and trades like a stock; in this case, a spot ETF for XRP.
Hybrid structure: Fund model that combines direct asset holdings with investments in related ETFs to increase liquidity.
Frequently Asked Questions About XRP Price Prediction
Does the $63M dump mean XRP is crashing?
No, the market absorbed it. Buyers showed up at $2 and price went up. The dump looks isolated, not a change in overall trend.
What is XRPR and why is it important?
XRPR is the first US spot XRP ETF (REX-Osprey). It combines direct XRP holdings with ETF investments and had $37.7M volume on debut; the biggest US ETF launch in 2025.
What are the price targets?
Analysts vary: moderate targets are around $5, while more aggressive estimates go up to $10 or $11 depending on ETF flows and breakout strength.
What level to hold?
$1.91 is the key support. If $XRP can’t hold that, downward pressure will intensify.
What event could tip the scale?
Big ETF inflows, regulatory clarity or a sustained breakout above resistance ($2.70 and the 200-day EMA) will favor the bull case.