






The BNB vs XRP discussion continues as the gap between their market cap and actual network output widens. On one hand, XRP has jumped back into the top slot with a previously recorded $93-$93.4B market cap, passing BNB. BNB Chain however is exhibiting strength below the surface.
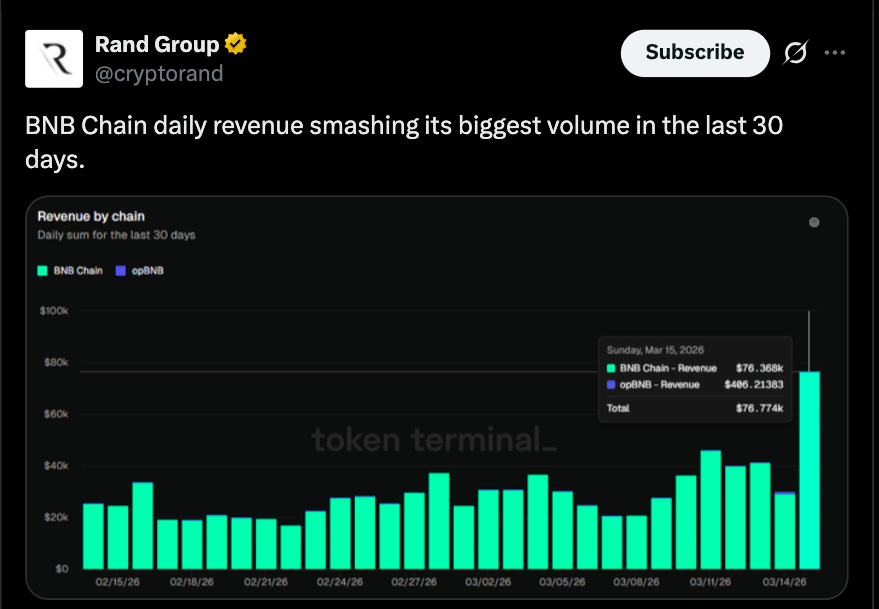
According to data from Token Terminal, the network saw daily revenues of $76.4K, its highest for the past 30 days.
XRP is riding high on market cap, but BNB Chain is delivering quantifiable economic activity, forcing speculation over whether the fundamentals are already priced into the market.
Real Activity Is Signaled by BNB Chain’s $76.4K Revenue Spike
Revenue is still one of the best indicators of how strong a blockchain is. It is based on actual usage; transactions, trading, and application activity.
BNB Chain’s latest daily revenue of $76.4K represents the highest level in 30 days, putting activity across the ecosystem at steady levels despite broader market moves.
This has supported to the suggestion that BNB’s network continues to draw users and developers even while its token temporarily drops in rankings.
Pure strength can be seen in XRP price and valuation, while the usage/revenue generation strength can be seen in BNB.
This matters because revenue indicates sustained demand, not a momentary positioning.
The $93 Billion Market Cap Lead of XRP Explained
According to recent market reports, XRP briefly reached about $93-$93.4 billion in market cap and outpaced BNB, which traded between approximately $87.7 billion and $92 billion during the period.
This came after a sudden spike in activity. Trading volume for XRP surged 125% to $3.22 billion during the rally. The token also broke above the $1.40 resistance level and reached around $1.53 at the time, which also showed strong momentum in the short term.
Derivatives data adds more. XRP open interest on future contracts increased 59% to approximately 353 million XRP, meaning that traders were not closing their positions but opening new ones.
Adoption metrics also improved. There were more than 46,767 active wallets in one day; a five-week high and the XRP Ledger topped seven million holders for the first time.
All of this fuels XRP’s ascent in the BNB vs XRP race but also suggests that the move is quite a bit market driven, rather than network revenue.
BNB’s AI Expansion Adds Long-Term Weight
Where XRP’s rise reflects current demand, BNB Chain is building towards future growth. BNBAgent SDK, a framework engineered to facilitate on-chain AI agents recently hit the market, according to CoinMarketCap.
It encompasses identity integration, escrow service, and a decentralized verification scope. This enables autonomous AI systems to perform transactions and interact within blockchain ecosystems.
AI agents market growth is expected to go from $11 billion to $251 billion, over 2000% surge in under a decade. This introduces a key difference in the BNB vs XRP comparison:
XRP’s current strength is notable because it is tied to market momentum and adoption, but BNB is preparing to grab a slice of a sector that could blow up in terms of growths coming from AI and automation.
XRP/BNB Ratio Shows No Clear Breakout Yet
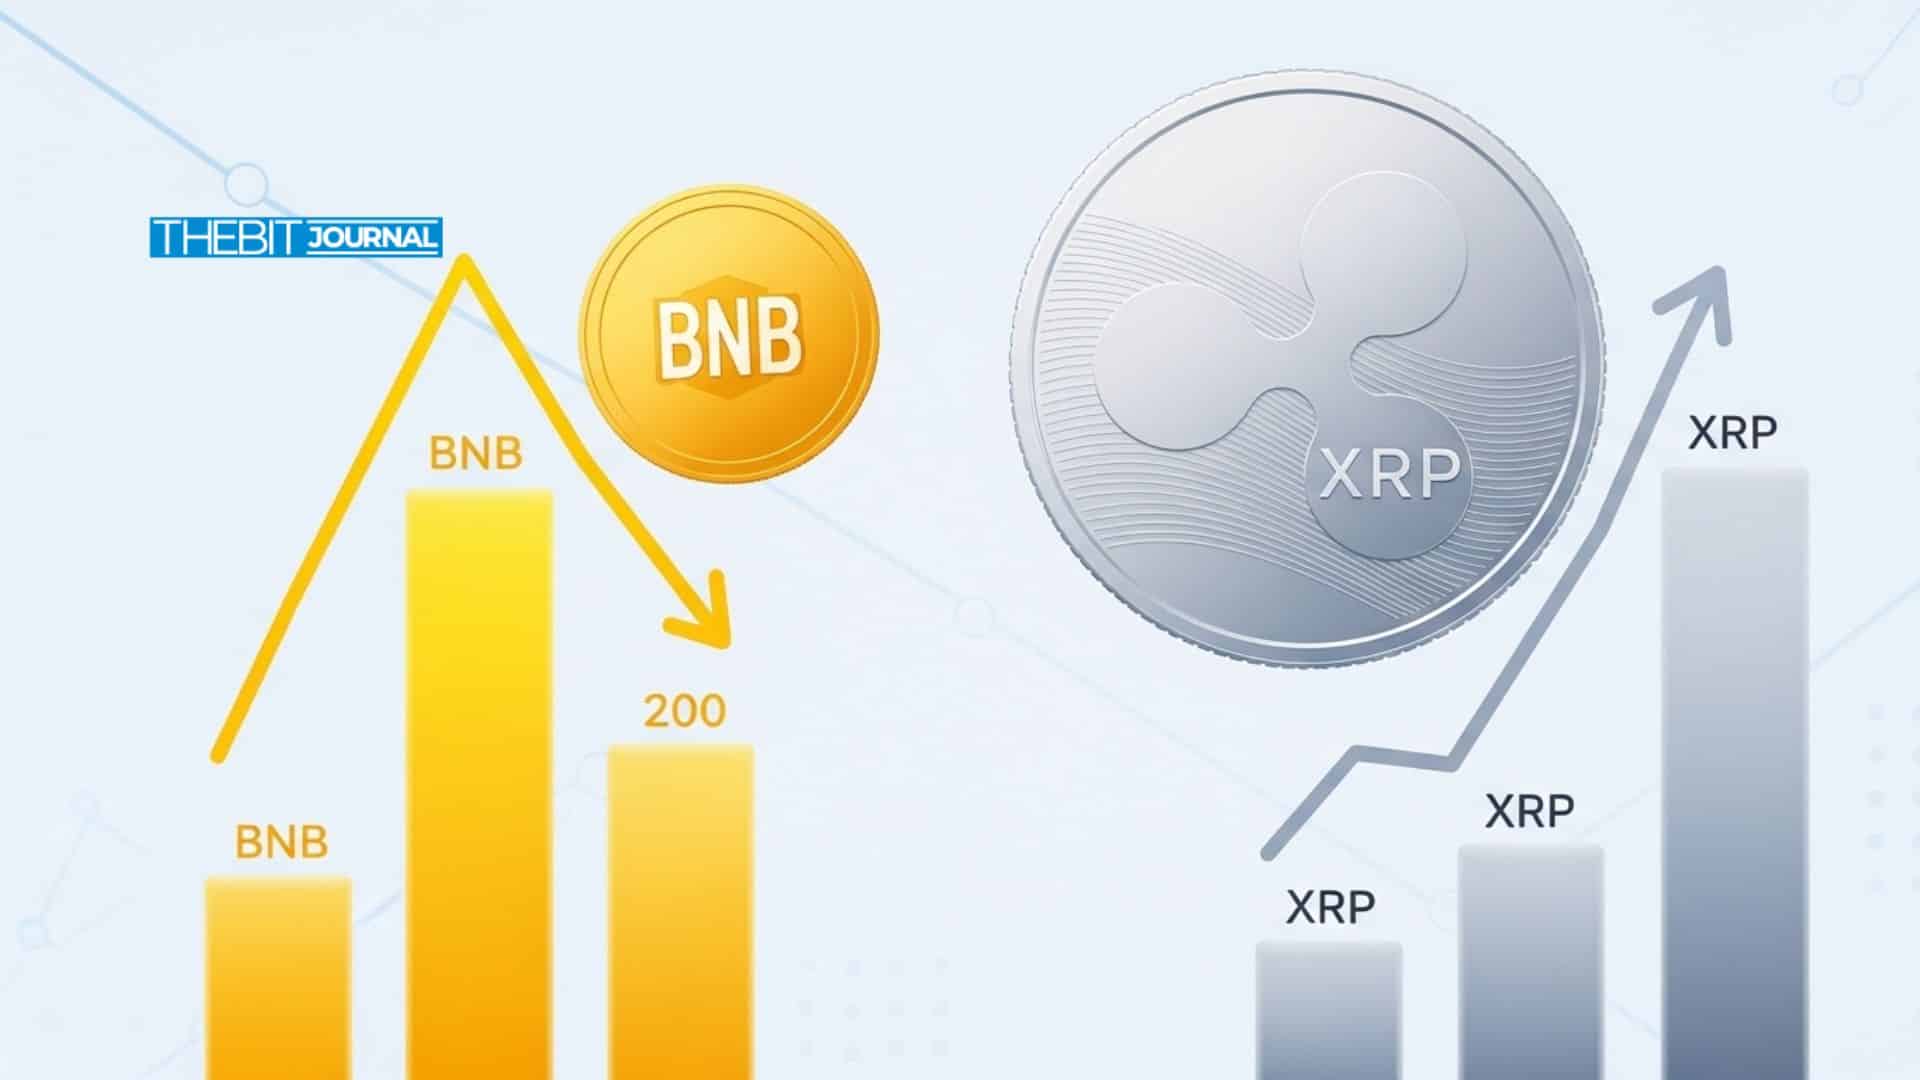
In spite of XRP beating BNB on market cap, a decisive long-term flip in the BNB vs XRP pair has yet to be confirmed. The ratio is up around 5.1% in a week but remains within a narrow range.
Notably, it is well below levels before the post-October 2025 market correction, when XRP had a much stronger relative momentum.That implies that the current move could still just be short-term positioning, as opposed to a real change in market leadership.
Looking back adds perspective. In 2025, BNB and XRP diverged similarly. BNB ended the cycle by going up 23%, while XRP was down 12%. This followed periods in which XRP looked better in the short-term, similar to the current situation.
Today, with BNB Chain providing a consistent revenue stream with exposure to growing AI infrastructure projects, the incentives for another divergence is there once more.
In the current BNB vs XRP scenario, will the market ultimately move in line with fundamentals or would it reward momentum-based valuation?
Conclusion
BNB vs XRP is not simply a case of one asset performing better than another. This is a prime example of when market perception and statistics don’t correlate.
With XRP recently going up to about $93 billion in market cap, caused by higher trading volume, derivatives activity and growing wallet participation, there is strong demand this cycle.
Meanwhile, BNB Chain’s $76.4K peak revenue, continued ecosystem activity and an expansion into AI-driven applications features a network that is still creating real economic value.
XRP is leading in valuation. BNB in the holding strong in usage.
Glossary
Market Capitalization: Pricing and circulation, to derive a cryptocurrency’s total value.
Blockchain Revenue: Transaction and network activity-generated fees.
Open Interest: Total inflow of active derivative contracts in the market
AI Agents: AI based autonomous programs that complete tasks
On-Chain Activity: The actions and transactions that take place directly on a blockchain.
Frequently Asked Questions About BNB vs XRP
Why did XRP overtake BNB?
Following new trading volume, derivatives activity, and user adoption of XRP, the asset’s market cap surged to approximately $93 billion.
What does BNB Chain’s $76.4K revenue mean?
It closely reflects actual usage across the network and suggests unwavering activity even as market cap trends up or down.
Does XRP compare to BNB at this moment?
In terms of valuation, yes. BNB has continued to stay strong in terms of network revenue and activity of the ecosystem.
What is BNBAgent SDK?
The framework under which AI agents can act on-chain with a built-in identity and verification.
References