






This article was first published on The Bit Journal.
XRP has been facing several lows over its recent sessions with both traders and on-chain analysts proffering bearish calls. Having severely dropped from its record level of about $3.66 in mid-2025, XRP price has broken down 60-61% from its peaks, with prices now ranging around $1.20-$1.30.
This XRP price drop has been shown by on-chain metrics, capital flow patterns as well as technical indicators that have put into perspective the possible extent of a further fallback should key supportive levels break down.
Historic Rally and Subsequent Retreat
XRP had one of its most rapid rallies among other large-cap cryptocurrencies from November 2024 to July 2025. The token surged from below 50 cents to nearly $3.66 due to better market sentiment over Ripple’s legal battle with the SEC, and increasing institutional interest.
This rally was short-lived, though, as greater crypto markets has seen huge volatility towards the end of 2025 and start of 2026. XRP price retraced back by about 61% from its peak, moving into levels last seen before the major rally began.
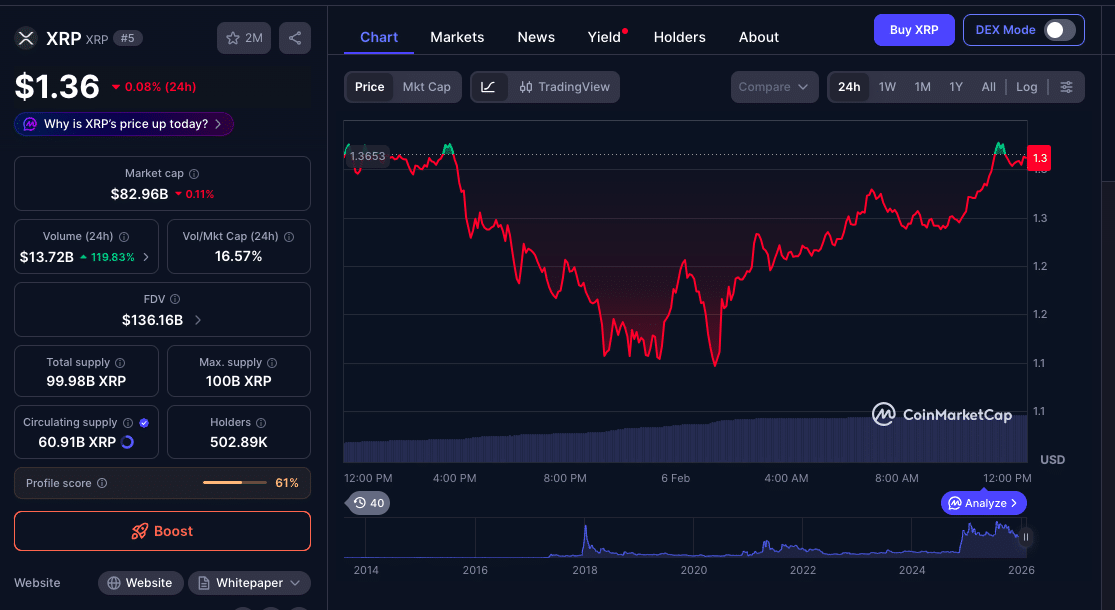
Continued losses indicate dampened short-term confidence even though long-term conviction about Ripple’s tech and regulatory clarity are available.
Despite this steep decline, XRP’s sell-off hasn’t been the simple sell-and-exit pattern. Recent data shows a gradual decline, with structural signs as opposed to panicked dumping.
Capital Outflows and Exchange Dynamics
One of the most telling signs of XRP price drop is in the way that capital has been moving across exchanges and the network. On-chain analytics reveal that realized capital impulse has been trending in the negative, which implies the XRP network is losing more value.
Analytics platform Alphractal has pointed out that this indicator has taken a powerful fall to the downside, implying strong net outflows which indicates profit taking and capital preservation among holders.
However, while the tendency of weekly exchange outflows has been diminishing over the past weeks, recent weeks have still seen approximately $89 million in XRP exit exchanges.
Getting tokens off exchanges is generally a bullish signal, meaning holders are prepared to have their assets out of circulation as opposed to being sold right away.
This capital leaving the network but also flowing into private wallets draws out in strong relief a separation between short-term capital preservation and medium to longer term holding behavior.
Bearish On-Chain Metrics Flash Red Flags
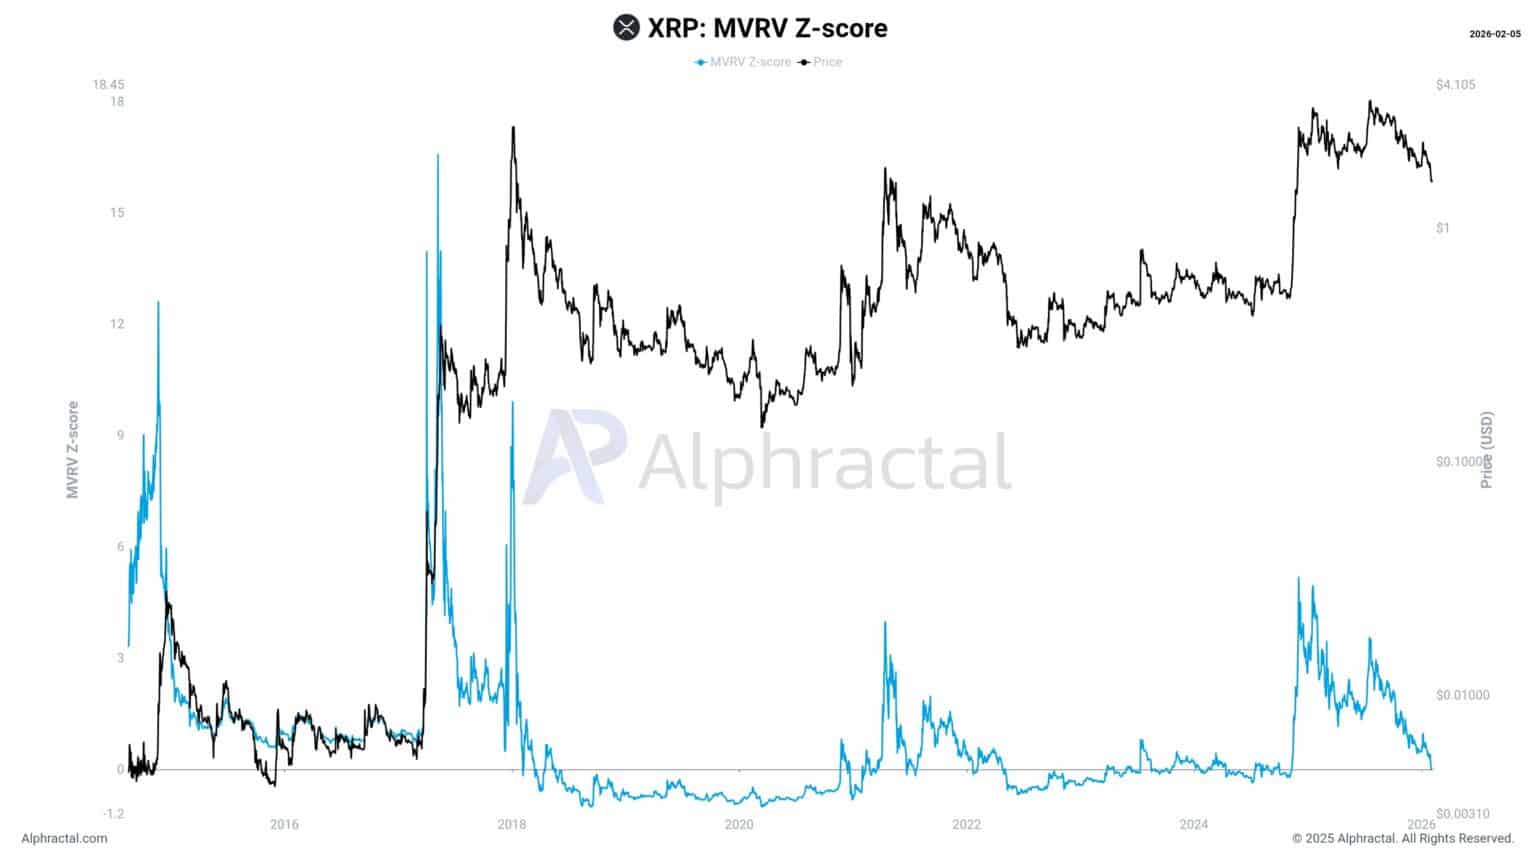
Several on-Chain metrics are pointing to red flags for XRP’s path forward. The MVRV Z-Score which helps investors to understand market value versus realized value, remains near a level of transition typically associated with trend changes.
According to analysts, “MVRV Z-Score is sitting right on the key level that defines either a bear market continuation or the last on-chain support.”
That means that if prices drop beneath this Z-Score’s neutral zone, distribution could intensify quickly.
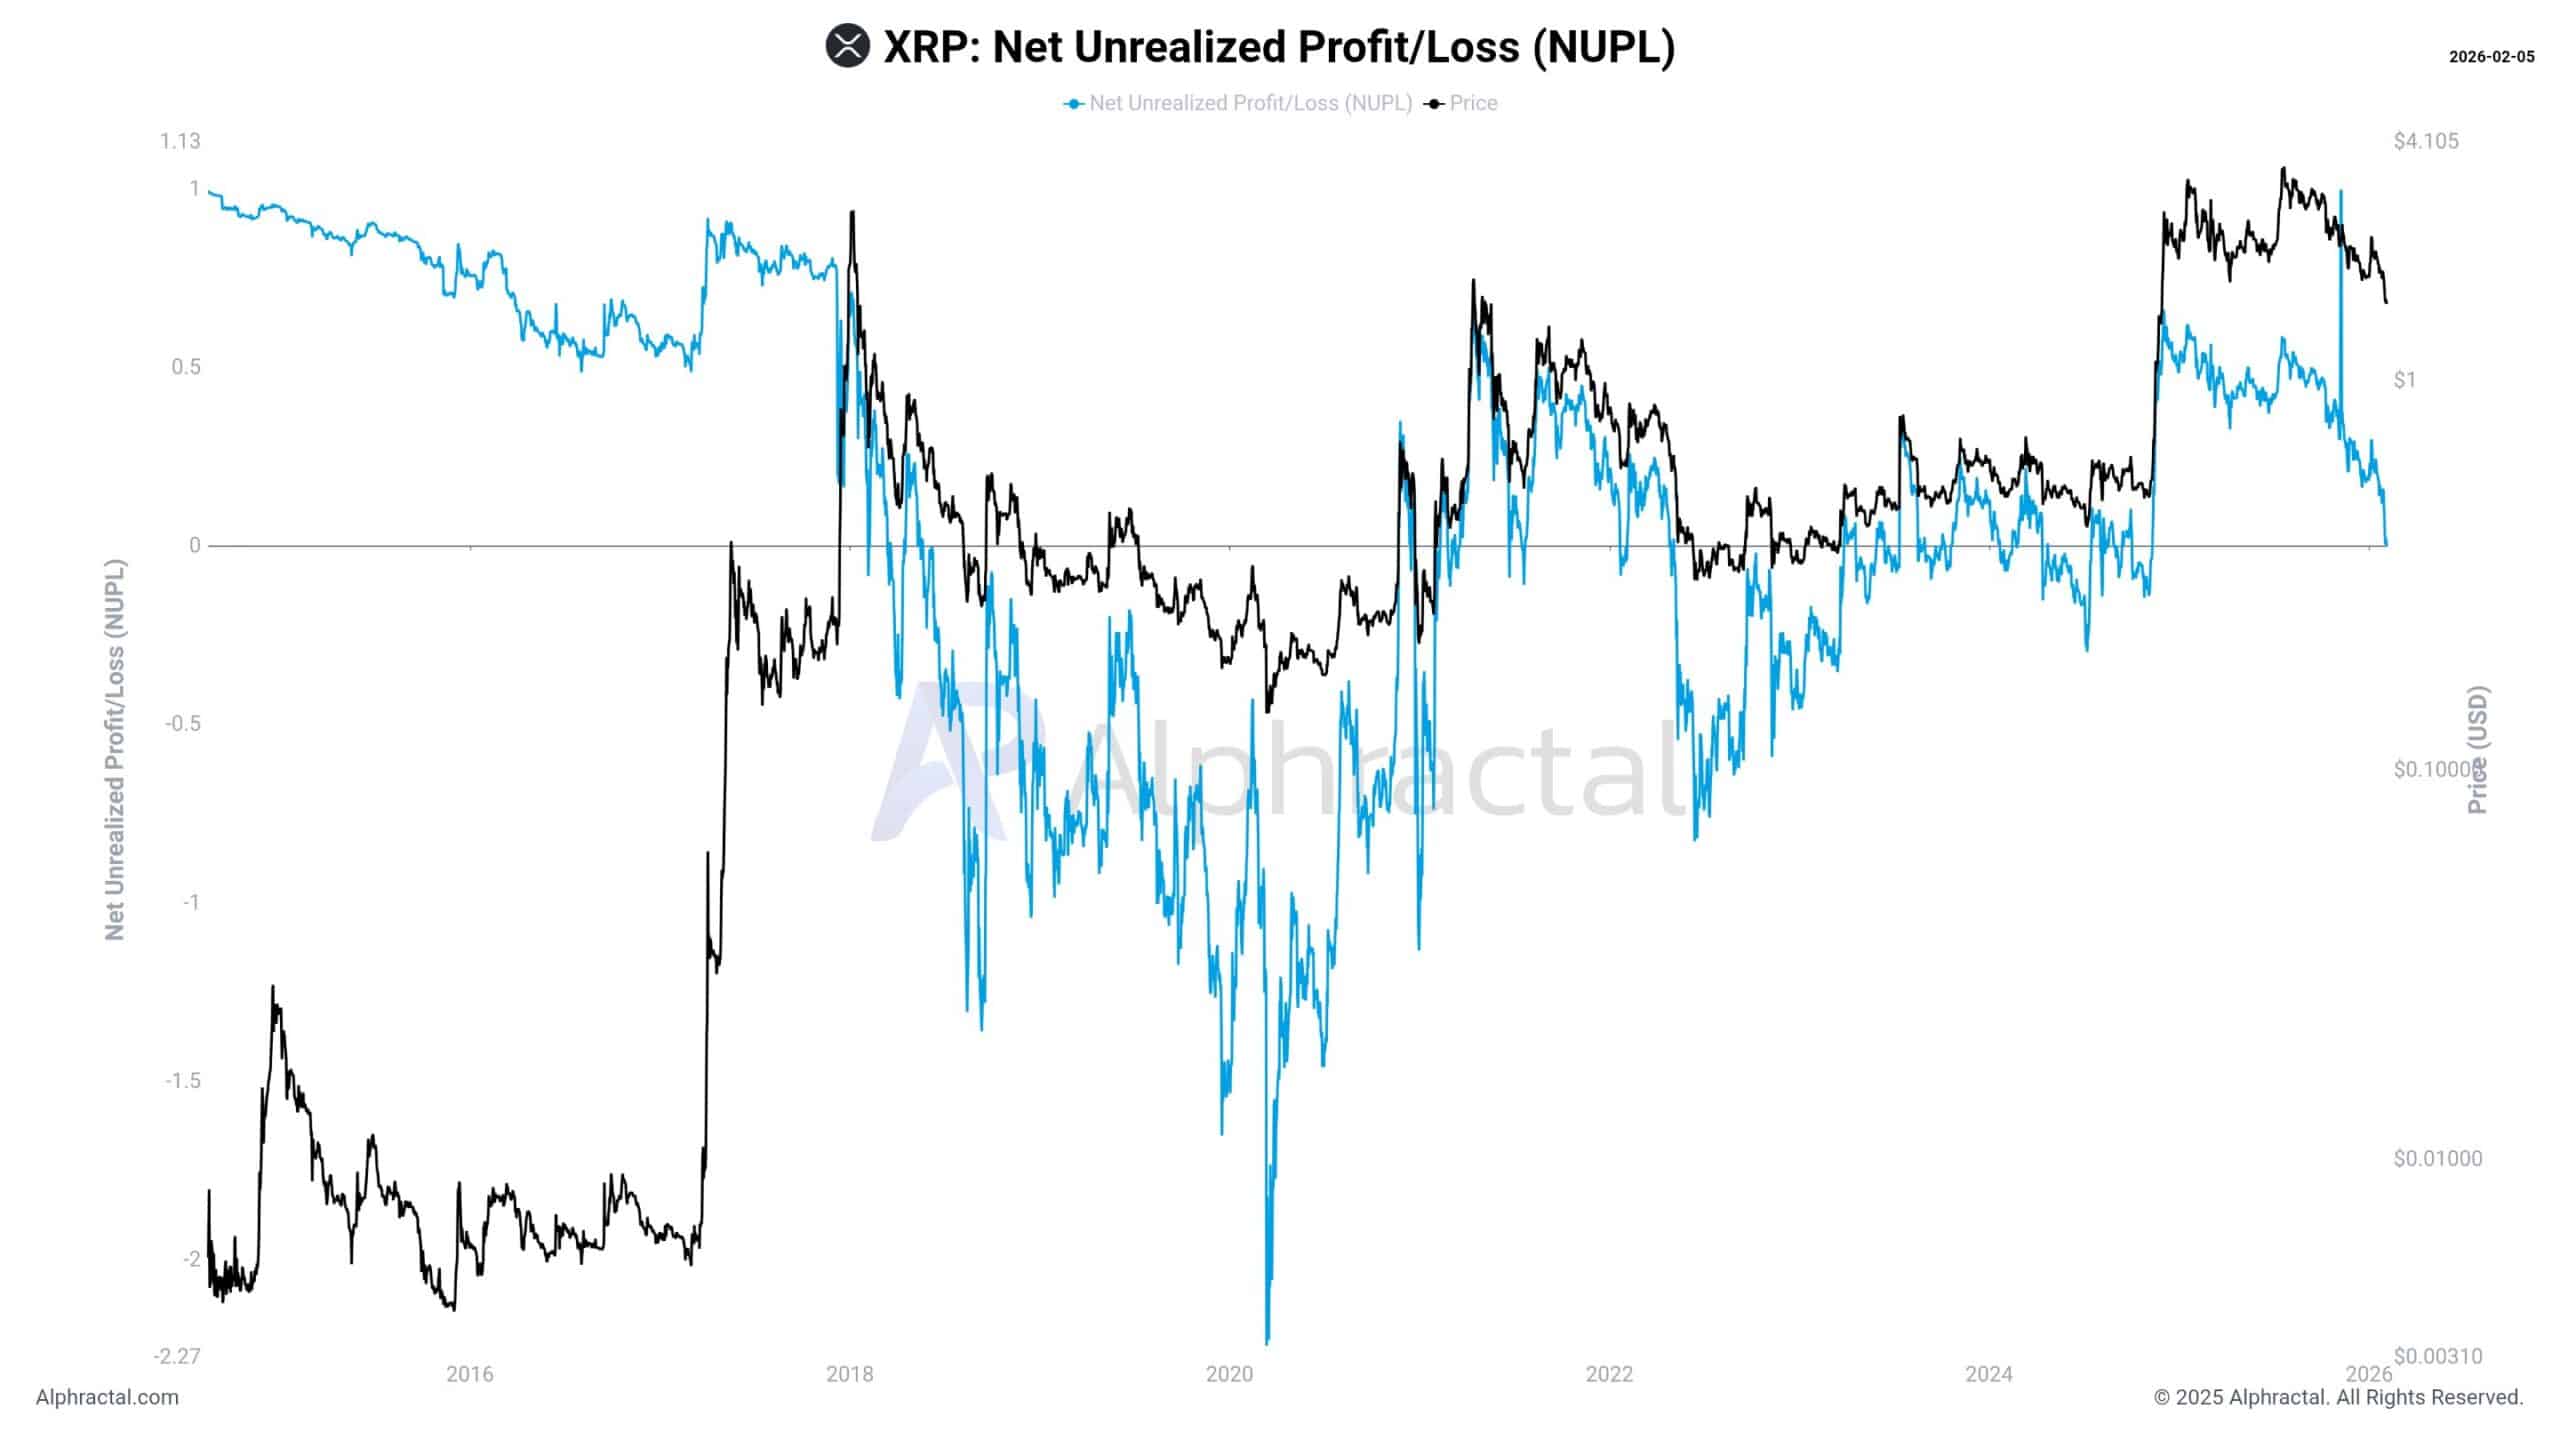
The same pattern is again in the Net Unrealized Profit and Loss (NUPL) metric, which determines whether most holders are profitable or not. When NUPL dips into the negative range, it indicates many holders are now underwater which tends to be linked with a raising selling pressure.
XRP has also moved under its realized price; a level indicating that the average holder’s cost basis exceeds current market prices. This has led to market pressure, as holders are less and less inclined stay in position now.
Combined, these stats tell of a diminishing structural support and increasing vulnerability to downside continuation unless buyer commitment picks up in a meaningful way.
Technical Structure and Near-Term Price Risk
Analysts note critical demand areas are being tested as trading prices edge toward, or even below, $1.20-$1.30. Should these areas fail to hold, it opens up a retest of the major psychological level around 1.00, a deeper retracement territory from the 2025 high.
Adding to the overall distribution bias, as evidenced by a negative Accumulation Distribution indicator, suggests continuous selling remains ahead.
This indicator’s weakening points to persistent selling pressure outpacing initial buying strength.
Market indicators such as relative strength indexes (RSI) also show oversold conditions, which sometimes trigger short-term bounces.
That said, oversold readings aren’t enough to guarantee sustainable rebounds without corresponding increases in trading volume and buyer demand.
So, technically structure and momentum-wise, indicators are saying that XRP is hanging in the balance at this point in time
Conclusion
The XRP price decrease unfolding at the moment is a retracement away from the highs printed in July 2025. These on-chain metrics such as Realized Cap Impulse, MVRV Z-Score, and NUPL are signaling weak demand dynamics and possibilities for further distribution pressure.
Meanwhile, outflows on exchanges and private accumulation indicate some holders are refusing to part with their longer-term positions.
Though near-term technical structure sees a critical demand area around current price action, the market’s capacity to recover stands on the border and will depend largely upon renewed buyer confidence and confirmable evidence of support.
Glossary
Realized Cap Impulse: a measure of net capital into/out of the blockchain economy based on transactional history.
MVRV Z-Score: compares market cap to realized cap in order to determine if the given asset is over or undervalued.
NUPL (Net Unrealized Profit/Loss): tracks the general profitability of holders, representing market sentiment.
Accumulation/Distribution indicators: a very powerful tool that helps every trader analyze volume and price information to define the buying and selling pressure.
Frequently Asked Questions About XRP Price Today
What’s causing the XRP price drop signal?
The decline of XRP is based on the net outflows from the network, bearish on-chain valuation metrics (MVRV Z-Score near critical levels), and failure to find a strong technical support at its present trading zone.
Is outflow of exchange always a sign of holding the long-term?
Not always. Exchange outflows are signs of holders sending assets to private wallets or custodial accounts, but they should be viewed along with price action and fundamental demand when determining long-term holding behavior.
Is XRP’s outlook being affected by institutional investments?
Although spot XRP ETFs have gathered some inflows, it has not translated into sustainable price strength as near-term technical headwinds remain.
Does XRP’s on-chain data always predict future price direction?
On-chain metrics provide a valuable insight into the market sentiment and can also be used for capital-flow analysis, however they should be considered in combination with other technical and macro analyses.
Will XRP rebound soon?
Near-term technical indicators such as the oversold relative strength index indicate potential rebound levels, but a sustainable recovery would require fresh demand and greater support at key price points.
References
AMBCrypto
blocknews
Trading News
MEXC