






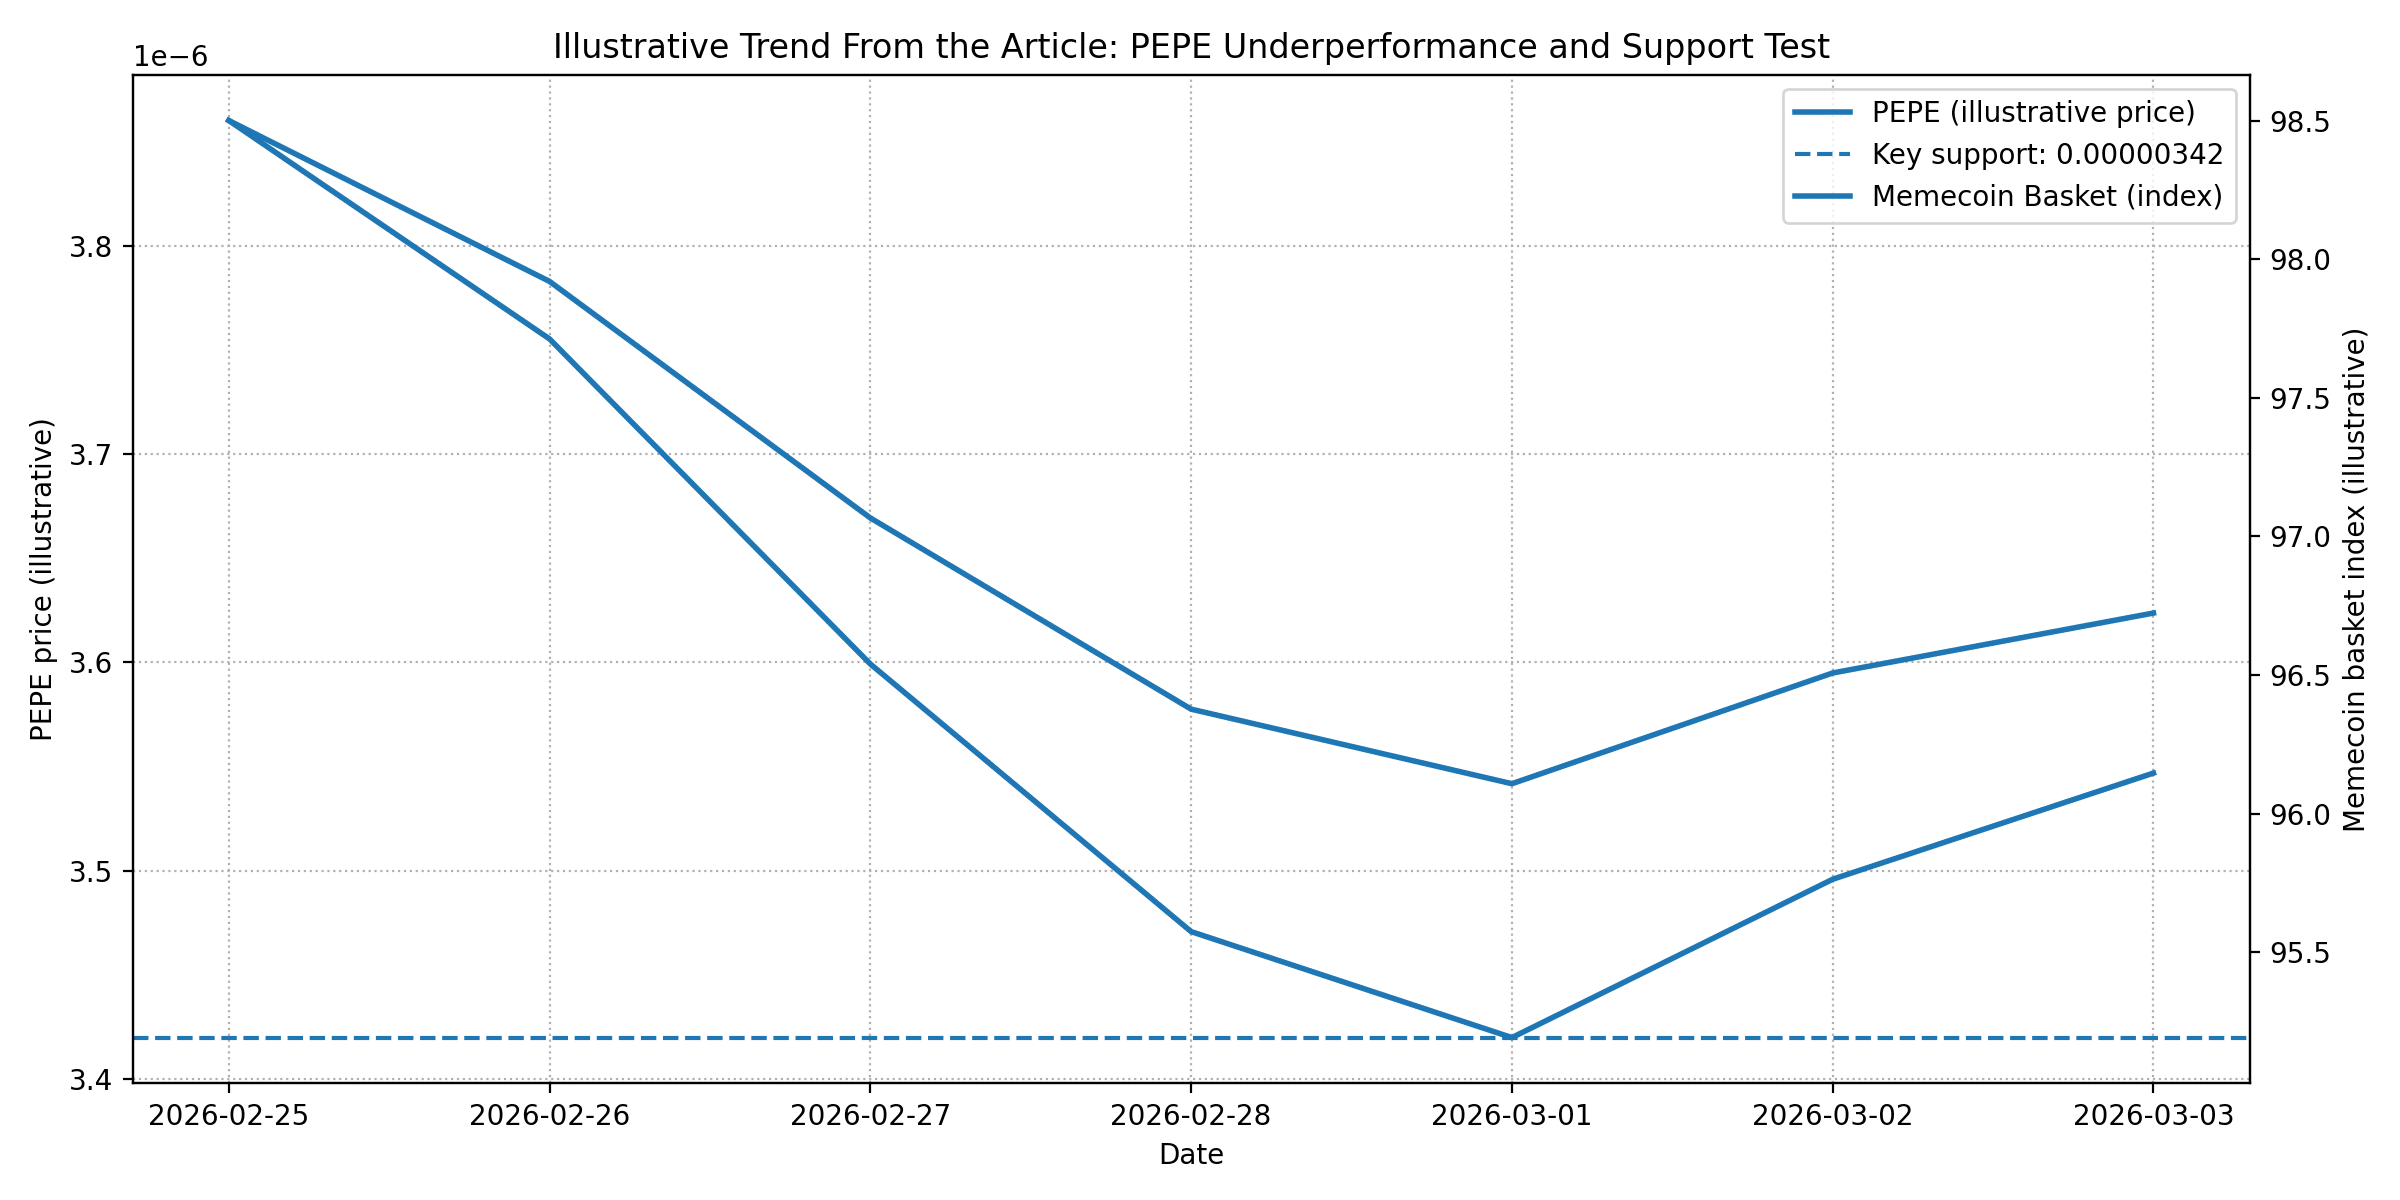
PEPE has spent the past week doing the one thing meme coin bulls hate most: underperforming its own peer group. While the broader meme sector has been soft, PEPE has looked softer still, sliding about 14.71% over 7 days and about 2.66% in the past 24 hours in the data cited by the original analysis. That relative weakness matters because meme coins often trade like a school of fish. When risk appetite returns, the leaders usually turn first, and when risk appetite fades, the laggards can keep bleeding even after the market tries to stabilize.
What follows is the cleanest way to read the setup: why PEPE market has become the weakest among popular memes, why that trend can be a warning to bulls, and which indicators actually help separate a bounce that sticks from a bounce that gets sold.
PEPE market: Why lagging peers is the first red flag
Relative strength is a simple concept with sharp teeth. If a token is falling with the sector, that is normal. If it is falling more than the sector, it signals that traders are choosing other vehicles for the same “meme beta.” In practice, that can happen for three reasons: liquidity rotates into larger, older meme coins during stress, leveraged traders cut exposure in thinner names first, or the chart breaks a level that triggers mechanical selling.
The latest read points to that third factor as well, with support around 0.00000342 highlighted as a key area to watch. When price keeps leaning on a support level without producing a decisive rebound, buyers start to look less like confident bidders and more like people trying to catch a falling knife.
That is why the PEPE market narrative is not just “price is down.” It is “price is down and the token is not winning the fight for attention inside its own category,” which is often how meme coin trends extend longer than traders expect.
A shaky support zone is not a bottom, it is a test of conviction
Support levels are only meaningful when they trigger real demand, not just a temporary pause. The level around 0.00000342 has shown up as a recent low and support reference in the circulating analysis. The warning sign for bulls is the structure around that zone. If price keeps revisiting the same floor, it can weaken it, especially when the broader market mood is risk-off.
In meme coins, there is an extra twist as many participants do not hedge, do not ladder bids, and do not scale exposure with volatility. They buy because of momentum and sell because the chart scares them. When price approaches support with fear in the air, even a small break can cascade into stop-loss selling, then forced selling from leverage.
This is where the PEPE market becomes a psychology story. A support line is not magic. It is simply the price where buyers previously stepped in. If those buyers are now underwater, the next visit becomes a negotiation, not a guarantee.
The indicators that explain “weakest among memes” without the hype
Technical indicators do not predict the future, but they can explain what the market is doing right now, which is exactly what traders need when sentiment is jumpy.
Momentum gauges such as RSI help show whether selling pressure is stretched or still expanding. One recent technical snapshot described a neutral-to-bearish posture depending on timeframe, with momentum not clearly flipping bullish yet. If RSI is low, a bounce can happen. But oversold conditions in meme coins often produce short relief rallies that fade unless volume confirms a real shift.
MACD is useful here because it tracks trend changes, not just exhaustion. When MACD stays bearish or only flattens, it suggests sellers are losing speed but not necessarily losing control. In other words, price can stop dropping fast and still keep drifting down.
Moving averages add another layer. When price trades below key averages, rallies often run into sell pressure as traders use those lines as exit zones. That pattern is common in the PEPE market when the crowd is trying to “get out even” after a drawdown.
Derivatives positioning makes the warning louder than the candles
Spot charts show what happened as derivatives data often shows what can happen next, because leverage changes the speed of moves.
Funding rates are a quick window into who is paying whom. A negative funding rate indicates shorts are dominant enough that they pay longs, which often appears when traders expect downside or are actively hedging. A perpetual funding read for PEPE showed a negative value around -0.02% as of 01 Mar 2026. Negative funding can sometimes set the stage for a squeeze, but only if price finds a base and shorts get trapped. If price keeps grinding lower, negative funding simply reflects persistent caution.
Open interest and liquidation dynamics matter, too. When traders deleverage across exchanges, coins with thinner liquidity can feel it first, and meme coins often sit at the front of that line. The warning for bulls is not just that the PEPE market is weak. It is that leverage can turn a small dip into a sharp flush, then leave price struggling to recover because the “fast money” has already exited.
Why bulls keep getting trapped: the difference between a bounce and a reversal
Meme coins are famous for violent bounces, which is exactly why traders keep buying dips. The problem is that a bounce is not a reversal, and the market punishes anyone who treats them as the same thing.
A bounce usually shows up as a quick pop off support, often on lower volume, often while broader sentiment is still tense. A reversal looks different. It typically includes a higher low, reclaiming a nearby resistance, and improving participation, meaning volume that grows on up days and cools on down days.
The original analysis also referenced downside mapping using an extension level, effectively showing that if support breaks, there are measurable zones where price can travel next. That is not doom-saying. It is simply how traders manage risk in the PEPE market when confidence is fragile.
What would actually improve the setup from here?
The path to a healthier chart is not complicated, but it does require patience:
First, price needs to hold support convincingly, not just touch it.
Second, momentum needs to shift from “less bearish” to “clearly improving,” which RSI and MACD can help confirm.
Third, derivatives need to stop leaning one-sided, because extremely skewed positioning can keep volatility elevated.
Finally, relative strength needs to return. If PEPE is going to stop being the laggard, it has to start outperforming other meme coins for more than a few hours. Until that happens, the PEPE market is effectively telling traders that capital prefers other memes when conditions get choppy.
Conclusion
PEPE has not only dropped in price, it has slipped in rank inside the meme coin mindshare battle, and that is why the “weakest among memes” label stings. With price leaning on support around 0.00000342 and derivatives data showing a cautious posture, bulls are facing a classic meme coin trap: plenty of sharp bounces, but not enough evidence of a durable reversal yet.
For the PEPE market to regain credibility, the chart needs to do the boring work first: stabilize, reclaim nearby resistance zones, and show stronger participation. If that process does not show up, then the warning is simple. In a risk-off tape, the weakest name in the group is often the last one traders trust with fresh money.
Frequently Asked Questions (FAQs)
Why is PEPE weaker than other meme coins right now?
The recent read is that PEPE has underperformed its peers over the past week, and it is testing a closely watched support zone. When a meme coin lags during sector weakness, traders often rotate toward names with deeper liquidity or stronger recent performance.
What price level is most important for PEPE in the near term?
The analysis flags 0.00000342 as a critical support area. If price fails to hold that region, traders often look to measured downside levels such as extensions and prior demand zones.
Does negative funding mean PEPE is about to pump?
Not necessarily. Negative funding, such as the -0.02% reading cited, can support a squeeze if price stabilizes and shorts get trapped. If price keeps sliding, negative funding can simply reflect ongoing caution.
What indicators best signal a real reversal instead of a quick bounce?
A reversal usually includes higher lows, reclaiming key moving averages, improving RSI and MACD posture, and healthier volume behavior where buying days show stronger participation.
Is this only a PEPE problem or a meme coin problem too?
The backdrop described is sector-wide softness, with PEPE standing out as one of the weaker performers inside that broader downturn.
Glossary of Key Terms
Relative strength: A comparison of performance versus peers or a benchmark. In memecoins, it often reflects where traders are rotating risk.
Support: A price zone where buying previously appeared, sometimes slowing or stopping a decline. It is a test of demand, not a guarantee.
RSI (Relative Strength Index): A momentum indicator that helps show whether selling or buying pressure is stretched.
MACD (Moving Average Convergence Divergence): A trend and momentum indicator that can signal shifts in directional control.
Funding rate: A periodic payment between longs and shorts in perpetual futures. Negative funding often reflects more short positioning.
Open interest: The total value of outstanding derivatives positions. Rising open interest can amplify volatility when liquidations hit.
Sources
Disclaimer
This article is for informational purposes only and does not constitute investment advice, financial advice, trading advice, or a recommendation to buy or sell any asset. Cryptocurrency markets are volatile, and meme coins can move sharply with limited liquidity.