






Toncoin price analysis indicates that TON remains in a critical consolidation phase as traders watch whether buyers can reclaim a major resistance zone and revive the broader recovery trend. After a powerful rally earlier in May, the cryptocurrency has spent several weeks moving within a tightening range, creating conditions that often precede a significant directional move.
With the corrective phase appearing to approach a resolution point, market participants are closely monitoring whether demand can overcome persistent selling pressure. TON is currently trading around $2.01, down 0.32% over the past 24 hours but up 6.19% over the last seven days.
The cryptocurrency’s market capitalization stands at $5.39 billion, down 0.35% during the same period. Daily trading volume is $403.79 million, a decline of 46.42%, while the volume-to-market-cap ratio currently stands at 7.55%.
What Does Toncoin Price Analysis Reveal About TON’s Recent Market Structure?
Toncoin price analysis shows that the asset remains in a corrective phase following an explosive rally that lifted the token from approximately $1.40 to a peak near $2.91. As profit-taking gradually absorbed momentum, TON entered a broad consolidation period. Despite the decline, the market never experienced a full structural breakdown.
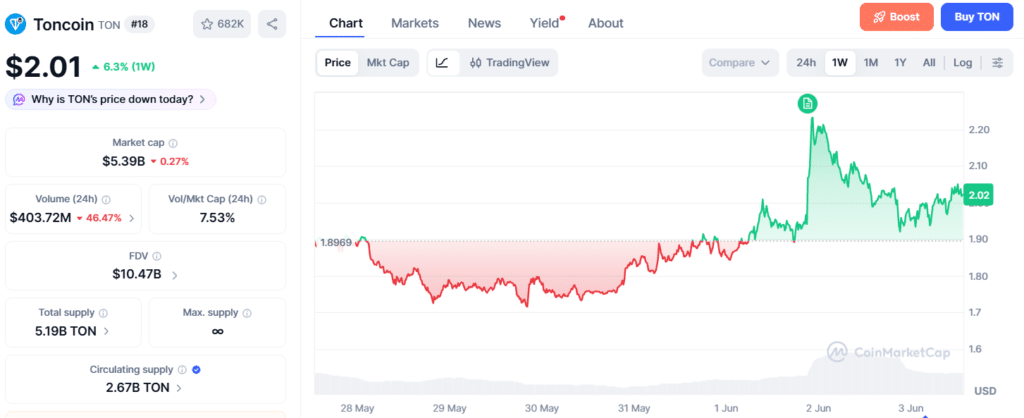
Instead, sellers repeatedly stalled near the $1.69-$1.80 demand zone, allowing buyers to establish a series of higher lows throughout late May. That recovery pushed TON back above $2.00 and later toward the $2.40 supply region, where renewed selling pressure emerged. The subsequent pullback suggests sellers remain active, although they have not yet regained full control of the broader market structure.
Why Is Toncoin Price Analysis Focused on the $2.28 Resistance Zone?
The $2.28 resistance level remains the most important barrier for traders evaluating TON’s next move. Toncoin price analysis indicates that the corrective phase may be approaching a resolution point as TON continues trading within a broader range defined by support near $1.69 and resistance around $2.28.
Since rebounding from the $1.69-$1.80 demand zone, buyers have repeatedly attempted to rebuild momentum. However, each advance has stalled before reclaiming overhead supply, highlighting the continued presence of sellers near key resistance levels.
This behavior suggests demand remains strong enough to prevent a broader breakdown but not yet strong enough to restart the wider uptrend. As a result, the market has entered a period of compression where both buyers and sellers continue defending their respective levels.
Market analysts often view prolonged consolidation as a battleground where available supply is gradually absorbed before the next directional move emerges. The current structure reflects that ongoing struggle as buyers attempt to strengthen their position while sellers continue defending resistance.
A move above $2.28 could open the way for TON to revisit $2.50, with the $2.50-$2.60 range likely to attract attention given its role during the May correction. If buying interest remains intact beyond that area, the previous high near $2.91 could come back into focus. Another rejection, however, may leave the token trading within its current range for longer.
What Do Technical Indicators Suggest About Momentum?
Current technical indicators present a neutral-to-moderately bullish picture. The Relative Strength Index (14) stands at 55.007, reflecting neutral market conditions. The Average Directional Index (14) is also neutral at 26.142.
Momentum (10) currently generates a buy signal at 0.256, indicating underlying buying strength remains intact. At the same time, the MACD Level (12,26) remains in sell territory at 0.025, suggesting that bullish momentum has not fully returned.
Longer-term trend indicators remain constructive. The Simple Moving Average (50) at 1.781 and the Simple Moving Average (100) at 1.535 both continue to generate buy signals. Together, these readings suggest the market remains in consolidation rather than a confirmed trend reversal.
What Does Liquidation Data Reveal About Market Sentiment?
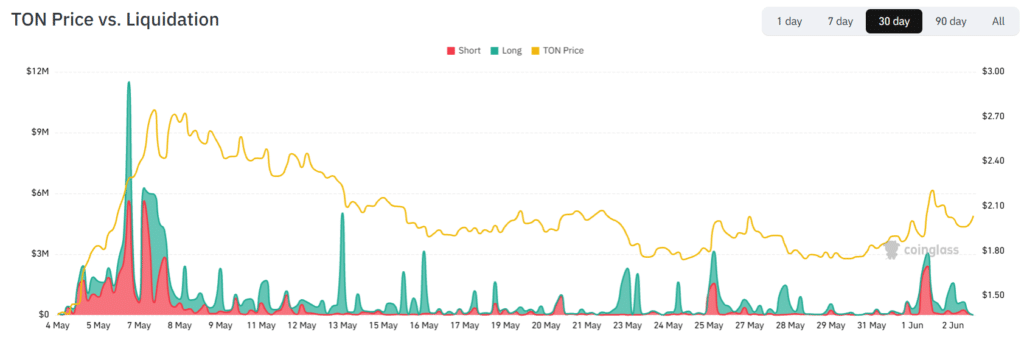
Recent derivatives activity highlights the impact of volatility on leveraged traders. Coinglass data shows total TON liquidations reached $4,020,031 over the past 24 hours. Long liquidations accounted for $3,265,154, representing 81.22% of total liquidations. Short liquidations stood at $754,876, or 18.78%.
More than 1,145 traders were liquidated globally as TON price volatility exceeded 8.5% during the session. Toncoin price analysis of liquidation activity shows that long-position traders absorbed the majority of recent losses during the pullback. Even so, buyers have continued defending higher support levels despite the increased volatility.
Could Buyers Reclaim Control Above Current Resistance?
A successful move above $2.28 could strengthen the recovery narrative and shift attention toward higher targets. Toncoin price analysis shows that repeated recovery attempts carry an important implication. Despite several rejections, sellers have failed to force the price back toward the critical $1.69 support area, suggesting buying pressure continues rebuilding beneath the surface.
If buyers reclaim $2.28, the market would move beyond simply defending support and begin challenging overhead supply. In that scenario, TON could advance toward the $2.50-$2.60 region which previously acted as an area of distribution during the May correction. A successful move through that range would place the $2.91 high back within reach and strengthen the case for broader trend continuation.
What Risks Could Challenge the Recovery Scenario?
The bullish outlook remains dependent on buyers maintaining control of key support levels. Toncoin price analysis also highlights that sellers remain active following the rejection near the $2.40 supply region. If $2.28 is rejected again the consolidation phase could extend further as traders wait for a stronger catalyst to emerge.
A failure to maintain support near $1.69-$1.80 would weaken the higher-low structure that has supported the recovery narrative in recent weeks. Without a stronger catalyst the market could remain range-bound for an extended period rather than immediately resolving to the upside. These factors continue to make resistance confirmation just as important as support preservation.
Why Does the $2.20-$2.40 Zone Matter for Trend Continuation?
The broader $2.20-$2.40 region remains a key area that could determine whether the recovery trend gains further traction. Toncoin price analysis indicates that if buyers successfully convert the $2.20-$2.40 range into support the path toward the previous high near $2.91 could reopen.

Such a development would signal that a significant amount of overhead supply has been absorbed and would reinforce the broader recovery structure. Until then traders are likely to focus on confirmation rather than anticipation.
Conclusion
Toncoin price analysis indicates TON remains in a higher-low pattern despite prolonged consolidation. Buyers have repeatedly defended the $1.69–$1.80 demand zone supporting the recovery thesis and preventing a deeper breakdown.
The market is approaching a key decision point with resistance at $2.28 and the broader $2.20–$2.40 region to watch. A sustained reclaim of those levels would favor a move toward $2.50–$2.60 and could set up a retest of the prior $2.91 high.
Glossary
Resistance Zone: A level where selling pressure increases.
Support Zone: A level where buying interest strengthens.
Market Capitalization: The total value of a crypto asset.
Profit-Taking: Selling an asset to secure gains after a rally.
Higher Lows: Buyers entering at progressively higher prices.
Frequently Asked Questions About Toncoin Price Analysis
What is the current TON price trend?
TON is trading in a consolidation range after its rally to $2.91.
Why is the $2.28 level important for TON?
The $2.28 level is a major resistance zone that could determine TON’s next move.
How much was liquidated in the TON market over the last 24 hours?
Approximately $4.02 million worth of TON positions were liquidated in the past 24 hours.
What do technical indicators suggest about TON?
Technical indicators show neutral to moderately bullish momentum for TON.
Can TON revisit its previous high of $2.91?
TON could retest $2.91 if buyers successfully reclaim and hold above $2.28 resistance.
Sources