





In crypto trading, volatility is a given. Prices swing wildly, news jolts markets, and trends can reverse in the blink of an eye. That makes the disciplined framework of technical analysis appealing. It offers a systematic way to read what the market is doing now, and anticipate where it might head next.
But, and this is key, technical analysis (TA) is not a magic wand. It is a toolkit, not a crystal ball. The best traders use TA along with judgment, risk rules, and awareness of fundamentals. One crypto trader on X recently noted, “Charts tell you what has been happening. You still need to guess what might happen.”
This article walks through the core principles, indicators, trade setup logic, pitfalls, and a realistic mindset for applying technical analysis in crypto trading.
What Is Technical Analysis, and Why Does It Matter
Technical analysis studies price, volume, and patterns to make probabilistic inferences about future moves. It rests on a few assumptions:
Price reflects everything: All known information is priced in.
Trends persist until reversed: Once a trend is established, it tends to continue until enough force changes it.
History tends to rhyme: Patterns tend to repeat because trader behavior often repeats.
Volume confirms trends: A strong move with good volume is more credible.
These are borrowed from classical TA roots and apply whether one trades stocks or crypto. But in crypto, because of its volatility, microstructure quirks, and news sensitivity, extra caution is needed.
Technical analysis gives structure to a chaotic market. It helps define entries, exits, stops, and targets. Yet it must be applied with humility; it works often enough to be useful, but never always.
The Foundation: Chart Types, Time Frames and Patterns
Before diving into indicators, one must understand how the data is presented.
Candlestick Charts and Price Action
Candlestick charts remain the workhorse. Each “candlestick” shows open, high, low, and close. Patterns like hammers, engulfing, doji, and pin bars hint at potential reversals or are signals of indecision.
Traders also look for classic patterns: double tops, double bottoms, head and shoulders, triangles, flags, and channels. For example, a descending triangle often suggests that the market might break downward, but always wait for confirmation.
Support and Resistance
These horizontal (or slightly sloped) lines mark where price has historically stalled or turned. Support is a price floor; resistance is a ceiling. Price often tests these zones repeatedly. A breakout via resistance or bounce off support can form a trade setup.
Trendlines and Channels
Drawing lines connecting consecutive highs or lows helps one see direction. Uptrend lines connect higher lows, downtrends connect lower highs. Channels are parallel lines that contain price action. Price riding a channel offers entry and exit zones.
Multiple Time-Frame Analysis
A setup visible on a 15-minute chart might look very different on a 4-hour chart. A prudent trader always checks a higher time frame to confirm that the micro setup is consistent with the macro trend. A bullish setup on the lower frame that conflicts with a bearish sentiment up on the daily chart is riskier.
Core Indicators for Crypto Trading
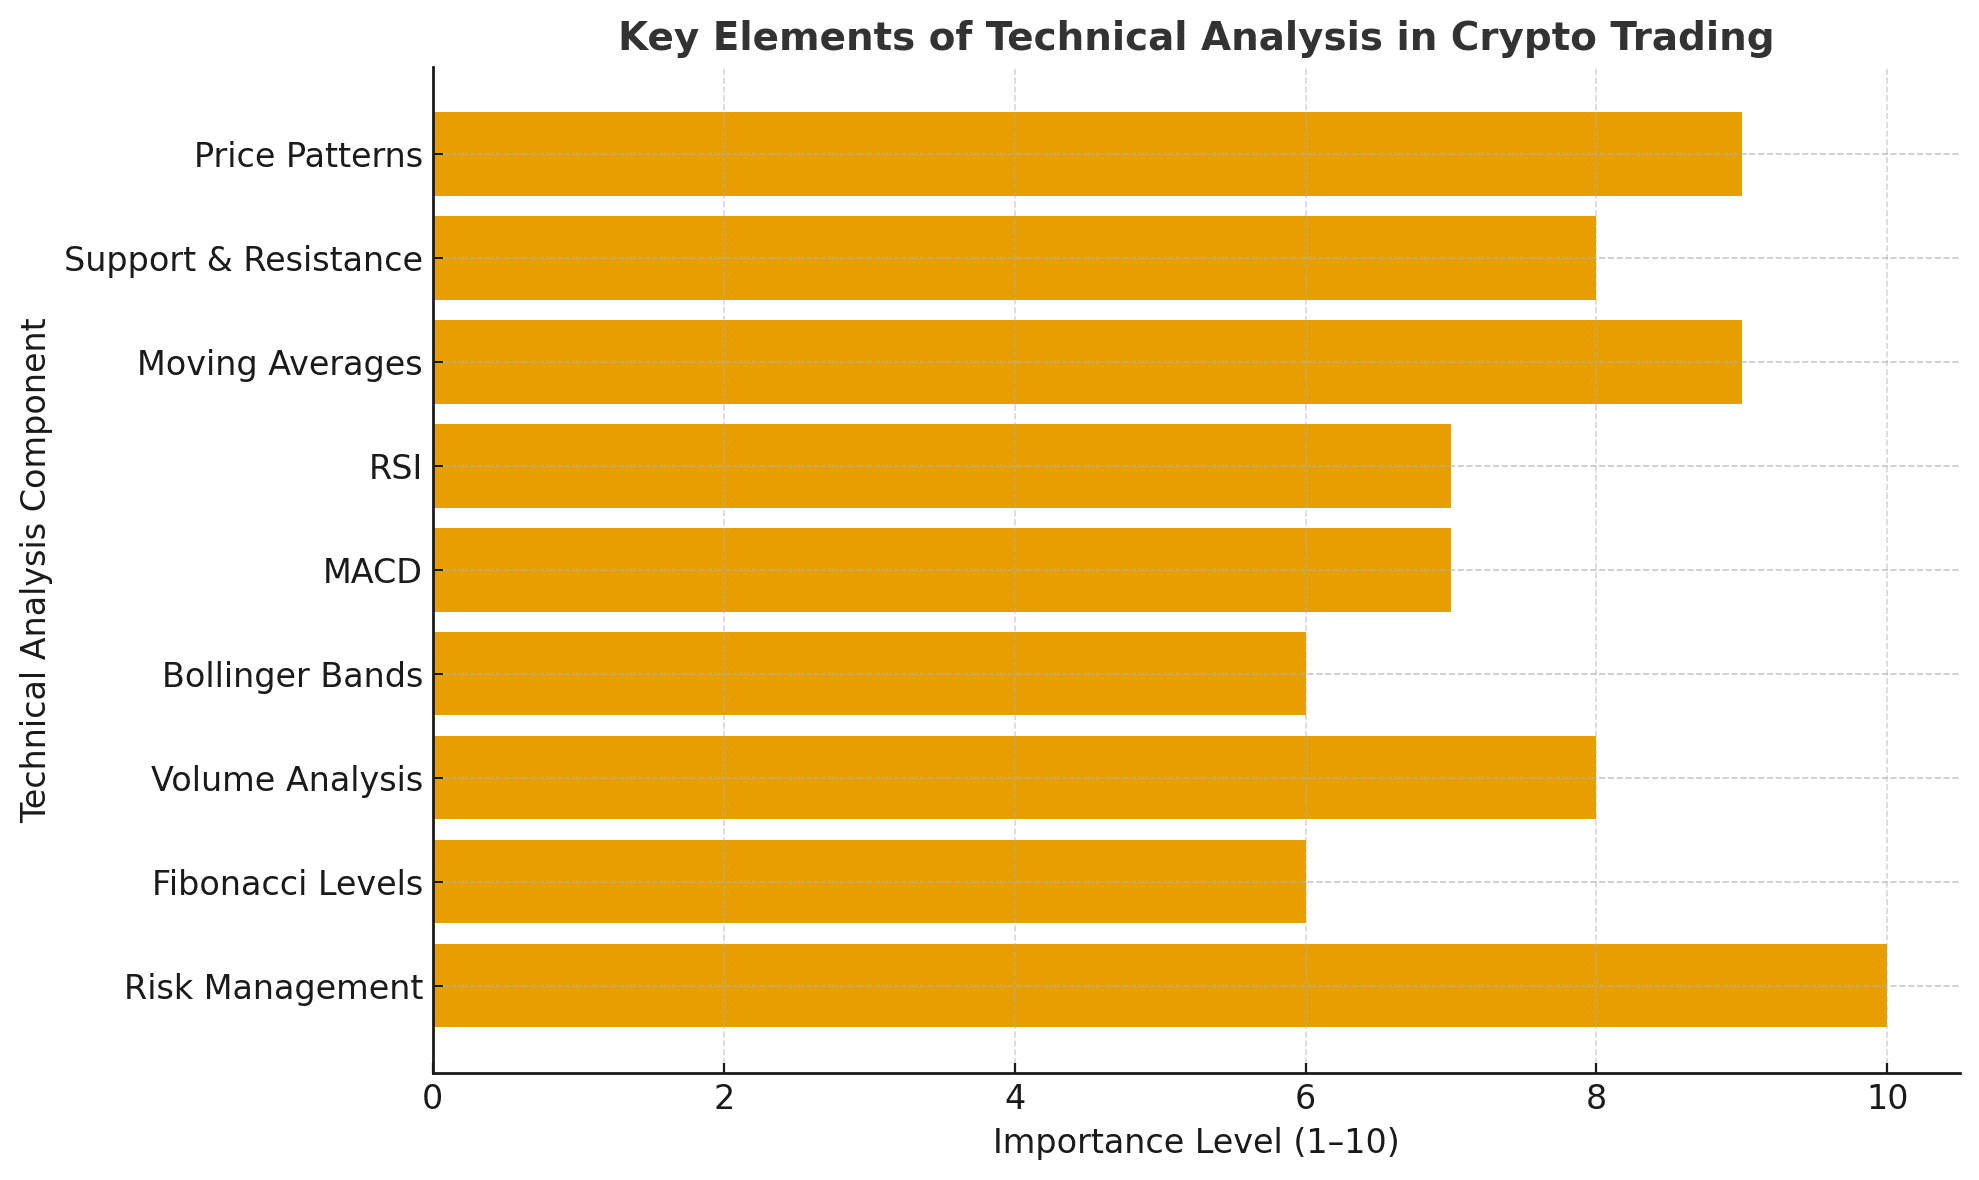
Once price structure is understood, indicators help frame strength, momentum, volatility, and trend changes. Below are key ones, how they work, and how traders use them.
Moving Averages (MA and EMA)
These smooth price by averaging over N periods. The simple moving average (SMA) gives each data point equal weight; the exponential moving average (EMA) gives more weight to recent data. In crypto trading, short-term EMAs like 9, 12, or 21 are common; medium ones are 50 and 100; long ones 200.
When a short MA crosses above a longer one, it may signal the start of a trend (“golden cross”). The reverse is “death cross.” Traders also use a price’s position relative to a moving average to gauge trend direction.
Relative Strength Index (RSI)
RSI is a momentum oscillator that measures how strongly price has moved in one direction over a set lookback (usually 14 periods). It ranges from 0 to 100. Above 70 often signals overbought (possible reversal), below 30 oversold (possible bounce). But in strong trends, RSI can stay overbought or oversold for long periods.
Traders look for divergences: for example, if price reaches a new high but RSI fails to, that could hint at weakening momentum.
MACD (Moving Average Convergence Divergence)
MACD is built from two EMAs (commonly 12 and 26) and their difference. A signal line (usually a 9-period EMA of the MACD line) shows when to act. When MACD crosses above signal, that is often a buy; below is a sell. The histogram (distance between MACD and signal) helps visualize momentum.
Traders also watch for divergence between MACD and price.
Bollinger Bands
These bands wrap around price using a moving average plus/minus a multiple (commonly 2) of standard deviation. They expand and contract based on volatility. A price hugging the upper band signals strength; a touch of the lower band may indicate oversold. Squeezes (band contraction) often precede big moves.
Stochastic Oscillator
This compares a crypto’s closing price to a range over N periods, giving two lines: %K and %D. Readings over 80 signal overbought, under 20 oversold. Crosses between %K and %D lines in extreme zones can trigger trades.
On-Balance Volume (OBV)
OBV aggregates volume flows: adding volume on up days, subtracting on down days. The idea is volume precedes price. If OBV rises while price is flat, bullish pressure may build.
Fibonacci Retracement and Extension
Based on Fibonacci ratios (23.6 %, 38.2 %, 61.8 %), this tool helps identify areas where price may retrace after a move, or where extensions may reach. Traders use it to set targets or stop zones in trending markets.
Commodity Channel Index (CCI)
The CCI measures the deviation of price from its statistical mean. Readings above +100 or below −100 hint at overextension and possible reversal. It works across various timeframes.
Building a Technical Analysis Trade Setup
It is one thing to know indicators; it is another to use them in a real trade. Here is how a trader might combine them.
Define the context
Look at the higher timeframe. If the daily trend is rising, downtrend setups on 15-minute are riskier.Locate support/resistance and structural patterns
Maybe price is approaching a major resistance zone or channel ceiling.Check indicator confirmation
If RSI is near overbought and MACD is diverging or crossing downward, that adds weight to a possible reversal.Volume confirmation
If a breakout or breakdown has high accompanying volume, it is likelier to hold. If volume is low, trap risk rises.Plan entry, exit, stop
Enter only when price confirms the setup (for example, closes beyond resistance). Place stop just beyond a swing high/low or structure. Target may align with the Fibonacci extension or the next structural level.Risk management matters more than perfect entries
Even the best setups sometimes fail. Use position sizing, define risk per trade (say 1–2 % of account), and never overleverage.
Differences and Cautions in Crypto Compared to Traditional Markets
Crypto trading markets behave differently in some key respects.
Volatility is extreme. Moves can be very fast. This means false breakouts are more common.
News sensitivity is high. A tweet, regulation news, or protocol update can override technical setups.
Markets run 24/7. Trends can evolve while a trader sleeps.
Liquidity differs across altcoins. Smaller-cap tokens may have erratic volume behavior and slippage.
As one voice on Reddit bluntly put it, “You cannot trade crypto using TA alone. You need to understand the technology and stay up to date with the news.”
Therefore, it is dangerous to rely purely on indicators without reading fundamentals, sentiment, or on-chain data.
How On-Chain & Hybrid Metrics Fit In
In addition to classical technical analysis, crypto trading offers unique, on-chain data like wallet flows, transaction counts, and network usage metrics. Hybrid traders combine TA with these data to strengthen signals. Research has found that combining technical indicators with social sentiment and on-chain metrics improves predictability.
For example, a bullish TA setup gaining extra confirmation from strong inflows into exchange wallets or rising active addresses is more credible.
Common Mistakes and How to Avoid Them
Overfitting indicators: Piling many oscillators often results in confusion, not clarity.
Chasing entries: Jumping in late after a move is halfway over.
Ignoring higher timeframe context: A promising lower-frame signal that fights the major trend is more likely to fail.
Crypto Trading emotionally: Letting fear or greed override defined rules.
Using wrong timeframes: Using an indicator suited for daily charts on a 5-minute chart can produce unreliable output.
Sample Trade Walkthrough (Hypothetical)
Suppose Bitcoin is in an uptrend on the daily. On a 1-hour chart, price rallies toward resistance at $45,000. The RSI is approaching overbought (around 70), MACD is flattening out and starting to curl, and volume is thinning out. A divergence forms between the price’s new high and the MACD, failing to confirm.
The trader waits for a bearish candle to close below the 1-hour trendline. Entry is placed just below. Stop sits just above the swing high. The target might align with the 38.2 % retracement level of the prior leg.
If volume spikes at the target, they may scale out or adjust stop. If price instead breaks above resistance with volume, the trader would scrap the short idea and consider a breakout trade instead.
Conclusion
Using technical analysis in crypto trading offers structure to chaos. It gives clarity where raw price on its own is confusing. But it is not a guarantee. Success lies in blending TA with risk control, market awareness, and a bit of humility.
Technical indicators should be viewed as signals, not commands. They help frame probability, not certainty. The confident trader treats each trade as just one in many, focused on risk-to-reward and clear rules.
Over time, the best traders evolve their intuition, pattern sense, and confidence. The charts whisper their stories, you learn to listen without deafening yourself with complexity.
Frequently Asked Questions
Q: Can technical analysis alone guarantee crypto trading profits?
A: No. TA is probabilistic, not deterministic. It gives context, not guarantees. Success also depends on risk management, fundamentals, sentiment, and discipline.
Q: Which time frame is best for crypto TA?
A: It depends on your style. Day traders favor 5-minute to 1-hour charts. Swing traders often use 4-hour to daily. Always check a higher frame for context.
Q: How many indicators should one use?
A: Simplicity often wins. Two or three complementary indicators (trend + momentum + volume) tend to work better than dozens.
Q: How does one avoid false breakouts?
A: Use confirmation, wait for a close beyond the level, check volume, and ensure the move aligns with trend direction. Consider fakes common in crypto.
Q: How do you combine TA with on-chain metrics?
A: Use on-chain metrics to validate or reject a technical signal. For example, a breakout supported by wallet inflows is stronger than one without.
Glossary of Key Terms
Candlestick: A visual representation of open, high, low, and close price over a time period.
Moving Average (MA / EMA): A smoothed line averaging past prices; EMA gives more weight to recent prices.
Relative Strength Index (RSI): Momentum oscillator measuring speed of recent price changes; ranges 0–100.
MACD (Moving Average Convergence Divergence): Trend/momentum indicator showing relation between two EMAs and their signal line.
Bollinger Bands: Bands around price formed by moving average plus/minus volatility multiples.
Stochastic Oscillator: Momentum indicator comparing close price to recent range, showing overbought/oversold.
On-Balance Volume (OBV): A running total that adds volume on up days and subtracts on down days.
Fibonacci Retracement / Extension: Tools based on Fibonacci ratios to find support/resistance and price targets.
Divergence: When price and indicator move in opposite directions, hinting at weakening move.
Support / Resistance: Price levels where buying or selling pressure historically builds.
False Breakout: When price briefly passes a key level but reverses, trapping late traders.