






XRP price prediction is now focused on whether the cryptocurrency can hold above the recently reclaimed $1.14 level after encountering renewed selling pressure. The latest move has shifted market attention from the breakout itself to whether buyers can defend the former resistance as support.
The current price structure reflects a market testing the strength of recent gains rather than confirming a new trend. XRP is currently trading around $1.14, up 0.43% over the past 24 hours, with a market capitalization of $71.25 billion and a 24-hour trading volume of $1.23 billion.
What does XRP price prediction suggest after the breakout?
XRP price prediction has entered a crucial stage after buyers finally pushed the token above the long-standing $1.14 resistance that had capped several previous recovery attempts. During the latest 24-hour session, XRP climbed from $1.1344 to $1.1454, posting a gain of 2.87%.
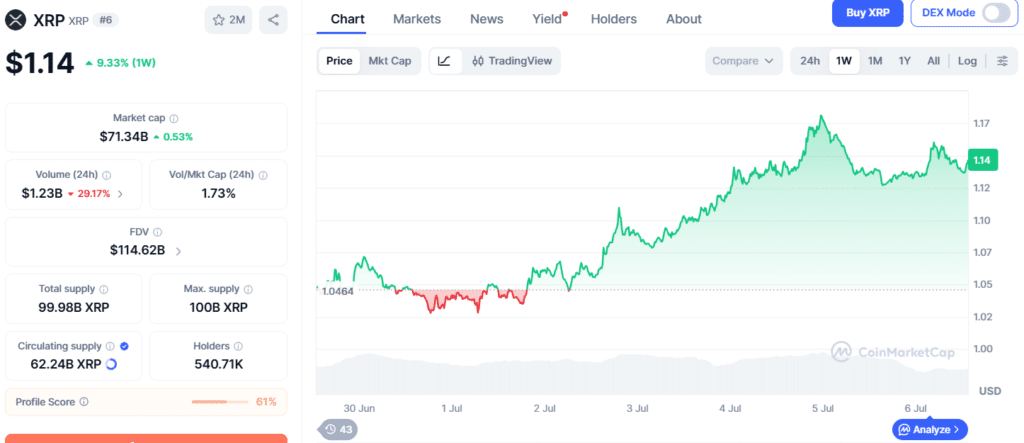
The breakout took place at 22:00 UTC on July 5 when trading volume surged to 81.89 million XRP, roughly 207% above the 24-hour average. Buying pressure then lifted XRP from $1.1356 to $1.1594 within two hours before sellers stepped in near $1.158. The pullback toward $1.146 transformed the previous resistance area into the first support zone that traders are now watching closely.
Why did the rally lose momentum near $1.16?
The advance slowed as sellers became more active once XRP approached higher resistance levels. Although buyers successfully cleared the $1.1400 barrier on strong volume, they failed to sustain momentum toward the next resistance zone. Selling pressure near $1.158 pushed XRP below the short-term $1.150 support level and prevented further upside.
The 60-minute chart also weakened after XRP repeatedly failed to reclaim $1.155. As a result, price action narrowed into a range between $1.145 and $1.151, indicating that buyers and sellers remain in a battle for short-term control. Even after the pullback, the broader short-term structure remains constructive as long as XRP continues to trade above the breakout area near $1.14.
What are technical indicators showing?
XRP price prediction continues to reflect mixed technical conditions, with improving short-term momentum but weaker longer-term signals. TradingView data places the Relative Strength Index (14) at 52.68199, suggesting neutral momentum. The Average Directional Index (14) stands at 22.28660, also indicating a neutral trend.
Meanwhile, the MACD Level (12,26) at −0.01695 continues to generate a buy signal. XRP also remains above its 20-day Simple Moving Average of $1.10272. However, the longer-term picture remains less supportive. The 50-day Simple Moving Average stands at $1.19113, while the 200-day Simple Moving Average is $1.47473.
Both continue to indicate a broader bearish trend. Several analysts have also highlighted improving technical structures, including a break of the four-hour downtrend, bullish divergence and the possibility of an Elliott Wave advance. These observations remain technical assessments rather than confirmation of a sustained market direction.
How are derivatives and investor positioning influencing sentiment?
XRP price prediction is also being shaped by activity across the derivatives market, where leverage continues to adjust following the breakout. Coinglass data shows XRP futures trading volume reached $1.77 billion, while spot trading volume totaled $266.81 million. Open interest currently stands at $2.43 billion, reflecting continued participation from derivatives traders.
Additional derivatives data shows futures volume declined 28.83% to $1.75 billion, while open interest slipped 0.16% to $2.44 billion. Options volume fell 16.31% to $1.47 million, although options open interest increased 1.24% to $25.22 million. During the past 24 hours, around $3.08 million in XRP positions were liquidated including $1.61 million in long positions and $1.47 million in short positions.
XRP futures trading generated $1,773,788,725 in volume during the period while open interest was recorded at $2,436,579,230, reflecting that leveraged positions remain active across the market. Recent performance reflects a mixed trend. XRP is up 9.53% over the past seven days, but it remains down 13.15% over the last 90 days and 48.28% compared with a year ago.
What other developments are shaping market sentiment?
XRP price prediction is also being influenced by developments beyond price charts. Spot XRP ETFs recorded a ninth consecutive week of net inflows, adding $17.19 million despite broader market uncertainty. The continued inflows indicate steady investor participation even as volatility remains elevated. Meanwhile, the CLARITY Act did not meet its expected timeline after the Senate adjourned for recess without holding a floor vote.
That delay postponed a regulatory event that many market participants had been watching. On-chain data from Santiment also showed XRP’s 30-day MVRV near -45% and 365-day MVRV near -47%, indicating that a significant share of holders remain below their average purchase price across both shorter and longer timeframes.
What should traders monitor next?
The immediate support area remains between $1.1400 and $1.145, making it the most important zone to monitor following the breakout. The first resistance level stands at $1.155. Beyond that, the next major resistance lies between $1.17 and $1.20. A sustained move above $1.20 would shift attention toward the $1.29-$1.30 area where previous breakdown levels are located.
On the downside, a decisive loss of $1.145 would weaken the current structure and shift focus back to $1.142 followed by $1.133. Until XRP decisively clears $1.155 and then the $1.17 resistance zone, the current move should be viewed as a breakout retest rather than a confirmed trend continuation.
What risks should traders keep in mind?
Even after the breakout above $1.14, XRP remains below both its 50-day and 200-day moving averages leaving the broader trend under pressure. A clean break below $1.145 followed by $1.142 and $1.133 would increase the possibility that the breakout has failed.
At the same time, Santiment’s MVRV data shows many holders remain underwater, meaning renewed downside pressure could weigh further on sentiment if buyers fail to defend the current support zone.
Conclusion
XRP price prediction still centers on whether buyers can protect the new support after breaking above $1.14. While steady spot XRP ETF inflows, better short-term technical signals, and active derivatives markets offer support, these haven’t confirmed a broader trend reversal yet.
Sellers remain active below the $1.17-$1.20 resistance zone, longer-term moving averages continue to lean bearish and the delayed regulatory timeline has removed an expected catalyst for now. Until resistance levels are reclaimed with sustained buying pressure, the market remains in a breakout retest phase, with price action around the $1.14-$1.145 support likely to determine whether the latest move extends higher or fades back into the previous range.
Glossary
Elliott Wave: A theory that identifies recurring price patterns.
Trading Volume: The amount of XRP traded over a period.
MACD: An indicator that signals trend momentum.
RSI: An indicator that measures buying and selling strength.
Simple Moving Average (SMA): The average price used to identify trends.
Frequently Asked Questions About XRP Price Prediction-
Why did XRP pull back after the breakout?
XRP pulled back because sellers became active near the $1.16 resistance level.
What is the next resistance for XRP?
The next major resistance is between $1.17 and $1.20.
How much XRP was liquidated recently?
About $3.08 million in XRP positions were liquidated over the past 24 hours.
Is XRP showing bullish momentum?
XRP is showing improving short-term momentum but the longer-term trend is still mixed.
What does high trading volume mean for XRP?
High trading volume shows that many traders are buying and selling XRP.
Sources