





Dogecoin (DOGE) price has declined by 2% in the past 24 hours, trading close to $0.20. In spite of hitting a swing high of $0.28 recently, the token has declined by 10 percent in the past seven days. DOGE trading volume amounts to $1.4 billion per day on average. Such volatility occurs in the backdrop of an overall cryptocurrency sell-off that has also swept through other assets in the market.
Dogecoin Price Struggles Amid Rising Market Volatility
The Dogecoin price has been subject to significant price movements and fluctuating volume recently. According to CoinGlass data, trading volume for $DOGE surged to $5.19 billion, marking a 54% increase in the past 24 hours. The open interest has also surged and at present, it is at 3.09 billion dollars. The volume in DOGE options rose by 30%, with $17 million in options trades, signaling heightened activity in the derivatives market.
Conversely, futures positions are experiencing a change. Open interest in DOGE futures has decreased from 19.7 billion $DOGE to 15.36 billion, signaling reduced leveraged positions. This change may signify that a few traders are choosing to be less aggressive in adhering to the unstable cost development in light of recent events.
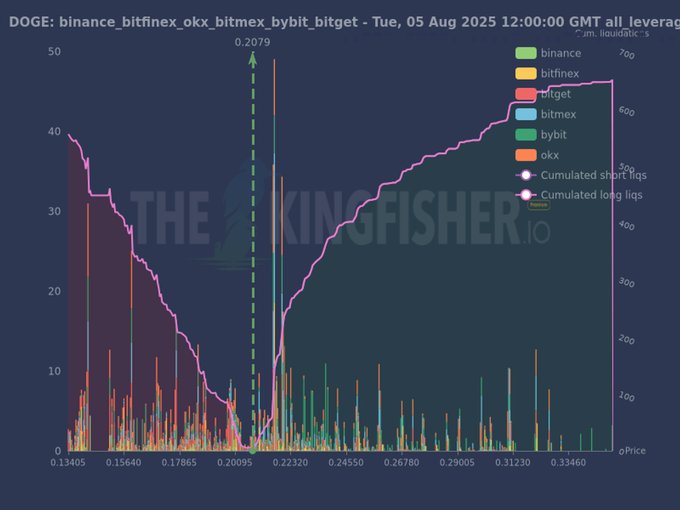
In the meantime, according to the liquidation map, the size of the most significant short liquidation cluster is around the $0.208 mark. A price move into this range could potentially trigger a short squeeze, which would put upward pressure on the $DOGE price.
Although the volume of the trade has increased, the market mood is not quite favorable, though. The clusters of liquidations give information regarding the location of forced liquidations. This may lead to sudden price movements in either direction over the coming weeks, highlighting the volatile nature of DOGE’s price action.
Technical Indicators and Chart Patterns
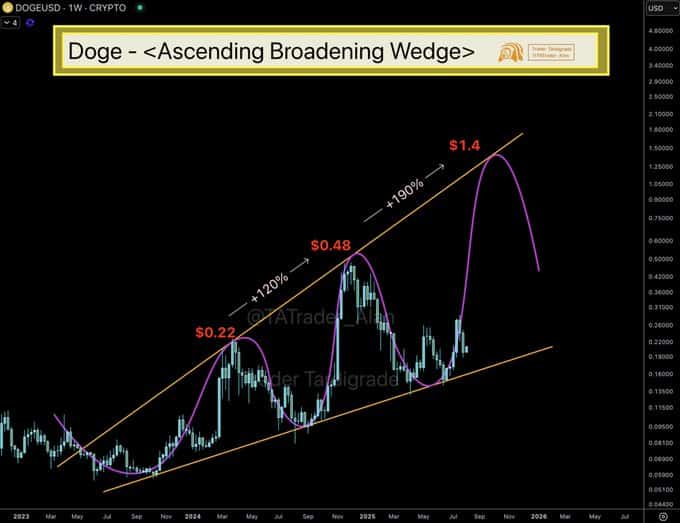
From a technical standpoint, Dogecoin is currently forming a pattern in its price chart that traders are closely monitoring. On the weekly chart, DOGE is moving in an ascending broadening wedge pattern. This trend has already been on of huge price movements with the latest movement in price between 0.22 to 0.48. The traders predict a possible further move to the top of the wedge at over $1.40.
The chart indicates an inverse head-and-shoulders pattern on the application of the shorter-term chart of one hour. The neckline on this pattern, at about 0.210, has proven short-term resistance. A breakout above this resistance level could push DOGE toward a price range between $0.214 and $0.218, offering potential upside in the near term.
However, despite some bullish chart formations, Dogecoin has struggled to break past resistance levels. DOGE recently traded near $0.20784 after a breakout, but it stalled below the key resistance at $0.215. A major explosive breakout is quite essential to propel the price towards higher targets above this level, and the market is undecided.
Broader Market Conditions and Outflows
The broader market context also plays a role in DOGE’s price movement. On August 5, an outflow of $11.54 million was registered, marking a failure to follow up on the purchase side. Regardless of these outflows, there are no indicators of a strong engine of upward price pressure, which evokes concerns regarding the extent of the current rally. Outflows can reflect accumulation behavior, but without corresponding buying interest, the Dogecoin price might struggle to maintain its upward trajectory.
Moreover, the broader trend in DOGE’s spot flows suggests that investors are moving assets off exchanges. Such a tendency shows a conservative pattern, as the interest in new purchases is low. The broader cryptocurrency market has also seen a decline, contributing to the weak follow-through in DOGE’s price.
In the near future, traders will be looking out for any indication of the $0.2150 resistance level being broken above. This is where a powerful rally may be a fresh sign of a bull run. Instead, further losses may be on the cards in case of a breakdown below the support at %0.20650 or $0.20200, with a possible test of the support at $0.19200.
For more crypto news, visit the platform.
Summary
Dogecoin price has faced significant pressure recently, losing over 3% in the past 24 hours. Inertia on the buy-side and in the market generally continued to pose a concern as the trading volume skyrocketed. Despite technical patterns suggesting potential upside, DOGE’s failure to break key resistance levels leaves the token at a crossroads. Traders will need to monitor for a decisive breakout or a breakdown to gauge the next move in the Dogecoin price.
FAQs
What is Dogecoin price now?
Dogecoin is trading at approximately $0.20 which translates to a 3 percent decline over the past 24hrs.
What is the decline in the price of Dogecoin in the last week?
The value of Dogecoin has been trending downward 10% over the last seven trading days.
How much is Dogecoin’s trading volume?
The current daily trading volume of Dogecoin shows a tremendous increase in market activity, reaching a current level of $1.4 billion.
What is the technical trend shaping up in Dogecoin?
The Dogecoin is under the process of forming an ascending broadening wedge in a weekly chart and an inverse head and shoulders in a weekly chart.
What is the significance of the $0.215 resistance level for Dogecoin?
The $0.215 resistance level is a key point for Dogecoin’s price to break in order to trigger potential upside movement.
Glossary of Key Terms
Open Interest: The sum of contracts (options or futures) that are still open and have not been settled.
Short squeeze: An occurrence in the market where an increasing price of an asset causes a short-seller to cover the position, further driving the hike.
Ascending Broadening Wedge: It is a type of chart pattern, indicating a growing volatility, which in most cases results in a high price movement.
Inverse Head and Shoulders: This represents a bullish chart pattern, which indicates a possible reversal of the trend direction (downward to upward).
EMA (Exponential Moving Average): This is a variety of moving averages, with greater emphasis placed on the newer price data.
References: